Design
A in vitro cytological observation.
Time and setting
The experiment was completed in the Experimental Center of Southern Medical University from July 2010 to October 2010.
Materials and main reagents
Adipose tissues were obtained from the adipose tissues of healthy youth who received liposuction, and donors were informed and signed the informed consent.
The main reagents used in the experiment to investigate the effect of ginsenoside Rb1 on the proliferation and osteogenic differentiation of human adipose-derived stem cells cultured in vitro were as follows: the ginsenoside Rb1 powder was provided by the China Institute of Pharmaceutical and Biological Products with the purity ≥ 98%.
The other reagents were as follows:
.jpg)
Methods
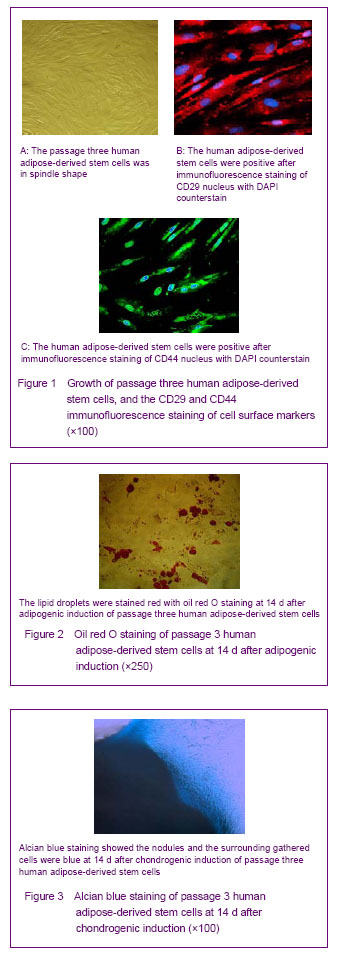
Separation, culture and identification of human adipos-derived stem cells
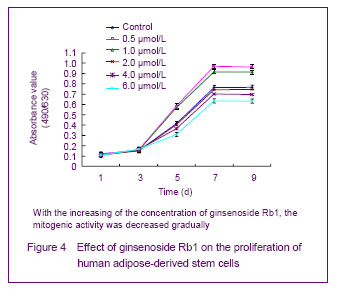
After liposuction, 5 mL adipose tissue were collected from healthy adults, and then washed with PBS repetitively. The primary cells were separated with 0.1% Ⅰ collagenase and seeded for culture. The solution was changed after 24 hours. After that, the solution was changed once every three to four days. After 6-8 days with the cell fusion of 80%-90%, the cells were digested with 0.25% trypsin, and sub-cultured with the percentage of 1:3. Inverted phase contrast microscope was used to observe the morphology and growth of the primary and passaged adipose-derived stem cells. The well-grown passage 3 cells were selected to prepare the cell suspension with the concentration of 1×10⁹/L. The creep plates of passage 3 adipose-derived stem cells were treated with CD29 and CD44 immunofluorescence staining, and the percentage of CD positive cells was calculated. When the passage 3 adipose-derived stem cells grew to 70%-80% of the bottom of culture bottle, the induction medium (containing 10% fetal bovine serum, 1 μmmol/L dexamethasone, 10 μmol/L insulin,
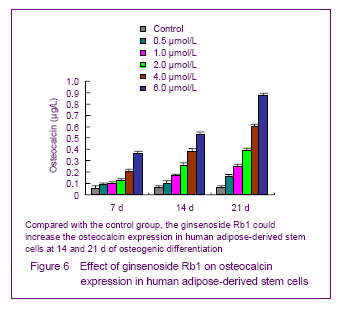
200 μmol/L indomethacin and 0.5 mmol/L isobutyl methylxanthine) was used to directly induce the cells to differentiate into adipose-derived stem cells, and the induction medium was changed once every 2-3 days. After induced for 6 days, the induction medium was changed for half. After directly induced for 2 weeks, oil red O staining was performed to observe the in vitro induction and differentiation. When the passage 3 adipose-derived stem cells grew to 100% of the bottom of culture bottle, the induction medium (containing 10% fetal bovine serum, 10 μg/L transforming growth factor β, 6.25 ng/L insulin, 6.25 ng/L transferring and
50 μmol/L ascorbate-2-phosphate) was used to directly induce the cells to differentiate into chondrocytes, and the induction medium was changed once every 2 days. After directly induced for 14 days, alcian blue staining was performed to observe the direct induction and differentiation.
Ginsenoside Rb1 intervention
The adipose-derived stem cells were seeded into the 96-well plates, 2×10³ cells per hole. After adherent, the original medium was absorbed, and then cells were cultured with 200 μL ginsenoside Rb1 (containing 0.05% dimethylsulfoxide solubilization) with the concentrations of 0.5, 1.0, 2.0, 4.0 and 6.0 μmol/L. The control group was set, and then cultured with the Dulbecco’s modified Eagle’s medium in the same dose (containing 0.05% dimethylsulfoxide solubilization).
Growth curve of the cells detected with 2,3-bis-(2-methoxy-4 nitro-5-sulphenyl)-(2H)- tetrazolium-5-carboxanilide method
After cultured for 1, 3, 5, 7 and 9 days, 20 μL 2, 3-bis-
(2-methoxy-4-nitro-5-sulphenyl)-(2H)-tetrazolium-5- carboxanilide medium with the concentration of 5 g/L was added to incubate for 4 hours under 37 ℃. The original medium was abandoned, and then added with 150 μL dimethylsulfoxide and sustained oscillation for 10 minutes. The microplate reader 490-630 nm was used to measure the absorbance value.
Determination of alkaline phosphatase activity [5]
The human adipose-derived stem cells were seeded on the 6-well plates, 2×10⁴ cells per hole. After adherent, 2.0 mL ginsenoside Rb1 with the concentrations of 0.5, 1.0, 2.0,4.0 and 6.0 μmol/L were added for culture, and the cells in the control group were added with Dulbecco’s modified Eagle’s medium with the same dose. After cultured for 3, 7 and 11 days, the cells were washed with PBS for two times, and then added with 100 μL ultra-pure water for ultrasonic degradation under 4 ℃. The alkaline phosphatase activity and total protein content in the cell lysates were detected with alkaline phosphatase detection kit and bicinchoninic acid kit, respectively. The alkaline phosphatase activity in each group was represented with alkaline phosphatase/total protein.
Quantitative detection of osteocalcin
The human adipose-derived stem cells were seeded on the 6-well plates, 2×10⁴ cells per hole. After adherent, 2.0 mL ginsenoside Rb1 with the concentrations of 0.5, 1.0, 2.0,4.0 and 6.0 μmol/L were added for culture, the ordinary culture medium was considered as the control group. After cultured for 7, 14 and 21 days, 0.5 mL culture medium was absorbed, pipetting with the procedures of bone gla protein kit, fully mixing, keeping for 20 minutes under room temperature, 3 500 r/min centrifugation under 4 ℃ (centrifugal radius of 15 cm) for 20 minutes. Abandoned the supernatant, and counted with γ-scintillation.
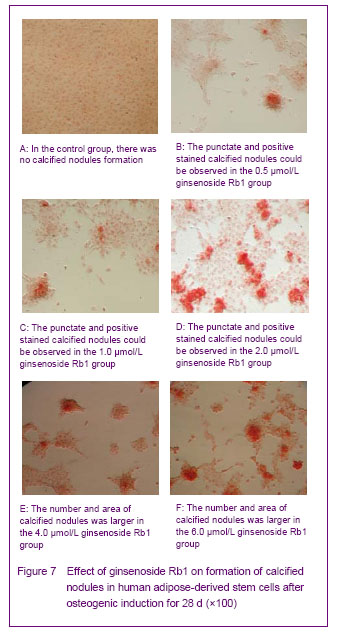
Alizarin red staining of calcified nodules [5]
The human adipose-derived stem cells were seeded on the 6-well plates, 2×10⁴ cells per hole. After adherent, 2.0 mL ginsenoside Rb1 with the concentrations of 0.5, 1.0, 2.0,4.0 and 6.0 μmol/L were added for culture, the control group was cultured with conventional medium in the same dose. Alizarin red staining was performed after cultured for 28 days: the cells were maintained with 95% alcohol under 4 ℃, 0.1% alizarin red (Tris-Hcl, pH 8.3) was added for staining under 37 ℃ for 30 minutes after washing. The red stained calcified nodules was considered as positive.
Main outcome measures
Growth curve of the cells, alkaline phosphatase activity, expression of osteocalcin and formation of calcified nodules were observed.
Statistical analysis
The SPSS 13.0 software was used by the first author for the treatment, and all the data were obtained through at least three independent experiments. The measurement data were expressed as mean±SD, and analyzed with variance analysis. Least significant difference method was used to compare the data, and P < 0.05 was considered statistically significant.