中国组织工程研究 ›› 2015, Vol. 19 ›› Issue (40): 6485-6491.doi: 10.3969/j.issn.2095-4344.2015.40.017
• 器官移植动物模型 organ transplantation and animal model • 上一篇 下一篇
新疆阿魏干预神经源性疼痛模型大鼠痛阈及脊髓Fos蛋白和星形胶质细胞的表达
黄异飞1,2,胡 炜1,李 磊3,刘岩路1
- 1新疆维吾尔自治区中医医院脊柱二科,新疆维吾尔自治区乌鲁木齐市 830000; 2新疆医科大学附属中医医院博士后流动站,新疆维吾尔自治区乌鲁木齐市 830000; 3新疆医科大学研究生学院,新疆维吾尔自治区乌鲁木齐市 830000
-
出版日期:2015-09-30发布日期:2015-09-30 -
通讯作者:胡炜,博士,副主任医师,新疆维吾尔自治区中医医院脊柱二科,新疆维吾尔自治区乌鲁木齐市 830000 -
作者简介:黄异飞,男,1969年生,广东省人,汉族,2003年北京大学医学部毕业,博士,主任医师,教授,主要从事脊柱相关疾病的中西医结合治疗。 -
基金资助:新疆维吾尔自治区自然科学基金项目(201233146-17)
Effect of Ferula sinkiangensis K.M. Shen on pain threshold and Fos protein expression and astrocyte activation in the spinal cord of neuropathic pain rats
Huang Yi-fei1, 2, Hu Wei1, Li Lei3, Liu Yan-lu1
- 1 Second Department of Spine Surgery, Traditional Chinese Medicine Hospital of Xinjiang Uygur Antonomous Region, Urumqi 830000, Xinjiang Uygur Antonomous Region, China 2 Postdoctoral Research Station, Traditional Chinese Medicine Hospital of Xinjiang Uygur Antonomous Region, Urumqi 830000, Xinjiang Uygur Antonomous Region, China 3 Postgraduate School of Traditional Chinese Medice Hospital of Xinjiang Uygur Antonomous Region, Urumqi 830000, Xinjiang Uygur Antonomous Region, China
-
Online:2015-09-30Published:2015-09-30 -
Contact:Hu Wei, M.D., Associate chief physician, Second Department of Spine Surgery, Traditional Chinese Medicine Hospital of Xinjiang Uygur Antonomous Region, Urumqi 830000, Xinjiang Uygur Antonomous Region, China -
About author:Huang Yi-fei, M.D., Professor, Chief physician, Second Department of Spine Surgery, Traditional Chinese Medicine Hospital of Xinjiang Uygur Antonomous Region, Urumqi 830000, Xinjiang Uygur Antonomous Region, China; Postdoctoral Research Station, Traditional Chinese Medicine Hospital of Xinjiang Uygur Antonomous Region, Urumqi 830000, Xinjiang Uygur Antonomous Region, China -
Supported by:the Natural Science Foundation of Xinjiang Uygur Antonomous Region of China, No. 201233146-17
摘要:
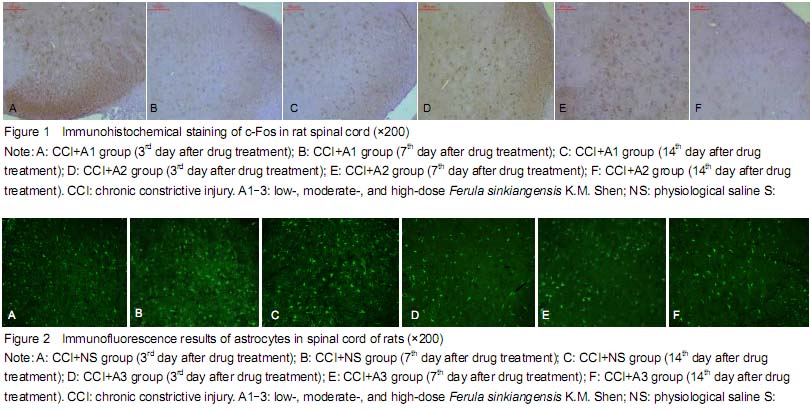
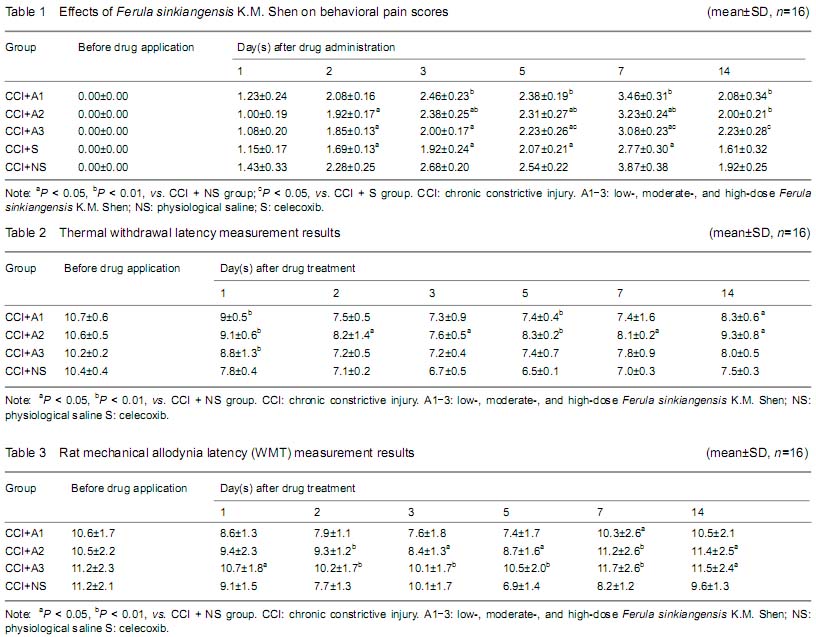
背景:新疆阿魏主要由挥发油、树脂和树胶组成,具有抗炎、抗过敏及解痉镇痛作用。但其镇痛作用机制尚不明确, 目的:观察新疆阿魏对神经病理性疼痛大鼠热痛及机械痛及脊髓Fos蛋白和星形胶质细胞表达的影响。 方法:成年SD大鼠80只制备慢性坐骨神经松结扎大鼠模型后随机分为5组:分别灌胃低、中、高剂量阿魏0.075,0.15,0.30 g/kg,赛来昔布和生理盐水。各组分别在术前1 d及术后1,2,3,5,7,14 d 进行热痛及机械痛测定,并取S4-5脊髓组织,并采用免疫组织化学染色的方法观察脊髓Fos蛋白和星形胶质细胞表达变化。 结果与结论:给药后1,5 d,低、中、高剂量阿魏组均高于生理盐水组(P < 0.01),中剂量阿魏组热痛阈值下降幅度最小(P < 0.05),高剂量阿魏组机械痛阈值减小幅度最小(P < 0.01)。术后各时间点低、中、高剂量阿魏组及赛来昔布组在的Fos蛋白阳性细胞数均小于生理盐水组(P < 0.05),中、高剂量阿魏组各时间点Fos蛋白阳性细胞数均高于赛来昔布组(P < 0.05)。高剂量阿魏组及赛来昔布组在术后各个时间点的脊髓组织星形胶质细胞阳性细胞数均明显少于生理盐水组(P < 0.05);中、高剂量阿魏组与赛来昔布组各时间点的星形胶质细胞阳性细胞数比较差异有显著性意义 (P < 0.05)。结果证实,新疆阿魏可以有效缓解大鼠神经病理性疼痛,其机制可能与脊髓Fos蛋白和星形胶质细胞的激活有关。
中国组织工程研究杂志出版内容重点:肾移植;肝移植;移植;心脏移植;组织移植;皮肤移植;皮瓣移植;血管移植;器官移植;组织工程
中图分类号:
引用本文
黄异飞,胡 炜,李 磊,刘岩路. 新疆阿魏干预神经源性疼痛模型大鼠痛阈及脊髓Fos蛋白和星形胶质细胞的表达[J]. 中国组织工程研究, 2015, 19(40): 6485-6491.
Huang Yi-fei, Hu Wei, Li Lei, Liu Yan-lu. Effect of Ferula sinkiangensis K.M. Shen on pain threshold and Fos protein expression and astrocyte activation in the spinal cord of neuropathic pain rats[J]. Chinese Journal of Tissue Engineering Research, 2015, 19(40): 6485-6491.
The number of animals and process of modeling
| [1] Bibi Y, Nisa S, Chaudhary FM, et al. Antibacterial activity of some selected medicinal plants of Pakistan. BMC Complement Altern Med. 2011;11:52. [2] Li XJ, Lin Jiang, Palida. Preparation and Investigation of the pharmacodynamics of effective antiulcerative composition in Ferula sinkiangensis K. M. Shen. Zhongguo Xiandai Zhongyao. 2007;9(10):8. [3] Sun Y, Liu HQ, Chen FF, et al. Observation of synergistic anti-inflammatory effect of combination of sodium ferulate and oxymatrine. Zhongcaoyao. 2011;42(3):538-541. [4] Gao TT, Yu FH, Tan Y, et al. Study on antimicrobial activity in vitro of extracts from three species of ferula root. Beifang Yuanyi. 2013;(24):156-158. [5] Jiang ZL, Wang SS, Wang YD, et al. The effects of Ferula sinkiangensis essential oil on the withdrawal syndrome of Morphine dependent rats and mice. Huaxi Yaoxue Zazhi. 2011;26(6):547-550. [6] Lv WH, Zhang L, Wu SJ, et al. Analgesic effect of ferulic acid on CCI mice: behavior and neurobiological analysis. Zhongfuo Zhongyao Zazhi. 2013;38(21):3736-3741. [7] Bennett GJ, Xie YK. A peripheral mononeuropathy in rat that produces disorders of pain sensation like those seen in man. Pain. 1988;33(1):87-107. [8] Zhang HY, Xue J, Tian F. Experimental study on acute toxicity of awei capsule. Zhongguo Yaoye. 2011;20(11):5-6. [9] Attal N, Jazat F, Kayser V, et al. Further evidence for ‘pain-related’ behaviours in a model of unilateral peripheral mononeuropathy. Pain. 1990;41(2):235-251. [10] Hargreaves K, Dubner R, Brown F, et al. A new and sensitive method for measuring thermal nociception in cutaneous hyperalgesia. Pain. 1988;32(1):77-88. [11] Chaplan SR, Bach FW, Pogrel JW, et al. Quantitative assessment of tactile allodynia in the rat paw. J Neurosci Methods. 1994;53(1):55-63. [12] Chen ZX, Wen XJ, Zeng YM, et al. The effect of mibefradil administered intrathecally and lateral ventricle to the pain threshold of the rats following chronic constriction injury (CCI) of the sciatic nerve. Zhongguo Yaolixue Tongbao. 2006;22 (5):571-575. [13] Del-Bel EA, Borges CA, Defino HL, et al. Induction of Fos protein immunoreactivity by spinal cord contusion. Braz J Med Biol Res. 2000;33(5):521-528. [14] Munglani R, Hunt SP. Molecular biology of pain. Br J Anaesth. 1995;75(2):186-192. [15] Milligan ED, Twining C, Chacur M, et al. Spinal glia and proinflammatory cytokines mediate mirror-image neuropathic pain in rats. J Neurosci. 2003;23(3):1026-1040. [16] Raghavendra V, Tanga FY, DeLeo JA. Attenuation of morphine tolerance, withdrawal-induced hyperalgesia, and associated spinal inflammatory immune responses by propentofylline in rats. Neuropsychopharmacology. 2004;29(2):327-334. [17] Watkins LR, Hutchinson MR, Ledeboer A, et al. Norman Cousins Lecture. Glia as the “bad guys”: implications for improving clinical pain control and the clinical utility of opioids. Brain Behav Immun. 2007;21(2):131-146. [18] Popovich PG, Wei P, Stokes BT. Cellular inflammatory response after spinal cord injury in Sprague-Dawley and Lewis rats. J Comp Neurol. 1997;377(3):443-464. |
| [1] | 曾 祯, 胡经纬, 李 璇, 唐琳梅, 黄志强, 李明星. 超声造影定量分析重度失血性休克再灌注模型大鼠复苏期的肾血流灌注[J]. 中国组织工程研究, 2021, 25(8): 1201-1206. |
| [2] | 唐 辉, 姚志浩, 罗道文, 彭双麟, 杨双林, 王 浪, 肖金刚. 高脂高糖饮食结合链脲佐菌素建立2型糖尿病性骨质疏松症大鼠模型[J]. 中国组织工程研究, 2021, 25(8): 1207-1211. |
| [3] | 伦志刚, 金 晶, 王添艳, 李爱民. 过氧化物还原酶6干预骨髓间充质干细胞增殖及体外向神经谱系诱导分化[J]. 中国组织工程研究, 2021, 25(7): 1014-1018. |
| [4] | 邹 刚, 徐 志, 刘子铭, 李豫皖, 杨继滨, 金 瑛, 张 骏, 葛 振, 刘 毅. 人脱细胞羊膜支架促进Scleraxis修饰人羊膜间充质干细胞体外成韧带分化[J]. 中国组织工程研究, 2021, 25(7): 1037-1044. |
| [5] | 陈俊毅, 王 宁, 彭称飞, 朱伦井, 段江涛, 王 烨, 贝朝涌. 脱钙骨基质与慢病毒介导沉默P75神经营养因子受体转染骨髓间充质干细胞构建组织工程骨[J]. 中国组织工程研究, 2021, 25(4): 510-515. |
| [6] | 姜 涛, 马 磊, 李志强, 寿 玺, 段明军, 吴 硕, 马 创, 魏 琴. 血小板衍生生长因子BB诱导骨髓间充质干细胞向血管内皮细胞分化[J]. 中国组织工程研究, 2021, 25(25): 3937-3942. |
| [7] | 徐晓明, 陈 艳, 宋 倩, 袁 露, 顾加明, 张丽娟, 耿 洁, 董 坚. 人胎盘间充质干细胞凝胶促进SD大鼠放射性皮肤损伤的愈合[J]. 中国组织工程研究, 2021, 25(25): 3976-3980. |
| [8] | 郝晓娜, 张英杰, 李玉云, 许 涛. 过表达脯氨酰寡肽酶的骨髓间充质干细胞修复肝纤维化模型大鼠[J]. 中国组织工程研究, 2021, 25(25): 3988-3993. |
| [9] | 徐伟龙, 左 媛, 辛大奇, 贺晨阳, 赵 鹏, 史 鸣, 周博源, 刘雅婷, 赵 岩. 急性钳夹型脊髓损伤模型大鼠造模方式的选择:一项网状Meta分析[J]. 中国组织工程研究, 2021, 25(23): 3767-3772. |
| [10] | 白胜超, 高 扬, 王 博, 李俊平, 王瑞元. 针刺干预大负荷运动损伤模型大鼠骨骼肌线粒体功能的动态变化[J]. 中国组织工程研究, 2021, 25(23): 3648-3653. |
| [11] | 张 亮, 马晓燕, 王佳虹. 肾衰饮调控慢性肾功能衰竭大鼠肾脏细胞凋亡的机制[J]. 中国组织工程研究, 2021, 25(23): 3672-3677. |
| [12] | 董丽萍, 罗怀青, 袁 衡, 龙 娟, 许少辉. 增龄对大鼠缺血后肢侧支血管生长的影响[J]. 中国组织工程研究, 2021, 25(20): 3156-3161. |
| [13] | 王朝格, 翁锡全, 林宝璇, 陈丽娜, 徐国琴. 低温运动干预肥胖大鼠的脂肪组织类型及功能改变[J]. 中国组织工程研究, 2021, 25(20): 3162-3167. |
| [14] | 崔田田, 易 岚, 欧阳厚淦, 吴慧婷, 欧阳彦楚, 陈 楚. 热敏灸对盆腔炎症模型大鼠影响的三焦焦膜理论分析[J]. 中国组织工程研究, 2021, 25(20): 3168-3172. |
| [15] | 李 平, 林 煜, 陈 翔, 刘振涛, 肖莉莉, 林学义, 华 鹏. 二至丸提取物干预去势骨质疏松雌性模型大鼠的骨重建特点[J]. 中国组织工程研究, 2021, 25(2): 191-195. |
Animals
Eighty Sprague-Dawley rats (male:female ratio of 1:1, weight 270±20 g) were purchased from Xinjiang Experimental Animal Research Center (Xinjiang Uygur Antonomous Region, Urumqi, China; Certificate No. SCXK2011-0003).
Methods
Preparation of rat models of chronic sciatic nerve injury
Rats were intraperitoneally injected with 10% chloral hydrate (3 mg/kg) for induction of surgical anesthesia. The hair on the lower back and thigh was shaved and the skin was sterilized. The rats were secured tightly, and neuropathic pain was induced by CCI as described previously[7]. Briefly, an approximately 2 cm incision in length was cut parallel to the femur in the rear middle thigh, gluteus maximus, and biceps flexor cruris directly dissociated to expose the sciatic nerve in the spatium intermusculare. The surrounding tissues were gently separated to expose the sciatic nerve, and three ligatures (silk 4-0) were placed around the nerve proximal to the trifurcation, with approximately 1 mm between each ligature. The ligatures were slowly tightened until a brief flick of the ipsilateral hind limb was observed. After nerve ligation, muscular and skin layers were immediately sutured with thread. Penicillin sodium was injected intramuscularly at 3 × 10⁴ U per rat for 3 successive days after surgery to prevent infection. All surgical procedures were performed under normal sterile conditions by the same experimenter.
Standards for the success of sciatic nerve injury
The main parts of sciatic nerve were subjected to a loose ligation with the first line before bifurcation. Three ligations were performed respectively with 1 mm spacing. Taking a mild calf muscles quiver as a symbol, sciatic nerve and arterial mild compression on nerve surface were visible under dissecting microscope, without blood flow interruption.
Grouping and drug administration
Eighty adult Sprague-Dawley CCI rats were randomly divided into five groups using a random number generator: low-dose Ferula. sinkiangensis K.M. Shen (CCI+A1), moderate-dose Ferula. sinkiangensis K.M. Shen (CCI+A2), high-dose Ferula. sinkiangensis K.M. Shen (CCI+A3), physiological saline (CCI+NS), and celecoxib groups (CCI+S).Ferula sinkiangensis K.M. Shen (Xinjiang Institute of Materia Medica, Urumqi, China) was mixed with distilled water and ground evenly in a mortar. Rats were intragastically administered Ferula sinkiangensis K.M. Shen at 0.075, 0.15 and 0.3 g/kg in the CCI+A1, CCI+A2 and CCI+A3 groups respectively, while physiological saline was intragastically administered (CCI+NS group) at 3 mL/100 g. The drug doses used were extrapolated from human studies. The moderate drug dose (1.5/60×6.5 g/kg) was calculated by conversion from a human study using the body surface area (BSA)[8]. The low dose was one half of the moderate dose, and the high dose was double of the moderate dose.
Behavioral pain scores
Thermal withdrawal latency measurement (TWL)
Rat mechanical allodynia latency measurement
Determination of Fos protein expression in spinal cord
Determination of astrocyte activation in the spinal cord
The spinal cord samples were cut into sections and stained for glial fibrillary acidic protein (GFAP). Briefly, paraffin-embedded spinal cord sections were dewaxed, made transparent in dimethylbenzene, hydrated in a graded alcohol series, and treated with citric acid for antigen retrieval. The sections were washed three times with PBS (3 minutes/wash), and blocked in (animal) serum in a humidity box at 37 ℃ for 30 hours. The blocking solution was removed, and slices incubated in mouse anti-GFAP (1:400; Sigma) at 4 ℃ overnight. Immunolabeled sections were washed three times with PBS (3 minutes/wash), and incubated in fluorophore-conjugated secondary antibody (1:100; Sigma) in a humidity box at room temperature for 1 hour. The sections were washed three times with PBS (10 minutes/wash), preserved with fluorescent mounting medium, and visualized under a confocal microscope. The spinal cord gray matter was demarcated into 4 Rexed layers: the superficial layer (Rexed layers I-II), laminae propria (Rexed layers III-IV), neck of the dorsal horn (Rexed layers V-VI), and ventral horn (Rexed layers VII-X). Six sections were sampled from the spinal cord of each rat, and the number of immunopositive astrocytes on each section was counted. The mean number of GFAP-positive astrocytes was calculated as an estimate of astroglial reactivity (activation). The staining intensity in individual cells was not taken into account for this estimation.
Main outcome measures
Statistical analysis
1 实验拟通过制作慢性坐骨神经松结扎大鼠模型,选用新疆阿魏大鼠进行灌胃治疗,给药剂量分别为0.075,0.15,0.30 g/kg,通过热痛及机械痛测定,采用免疫组织化学的方法观察脊髓Fos蛋白和星形胶质细胞表达的变化,探讨新疆阿魏对慢性坐骨神经松结扎模型大鼠的镇痛效果及机制。
2 结果证实新疆阿魏可以有效缓解大鼠神经病理性疼痛,脊髓Fos蛋白和星形胶质细胞的激活可能参与并在其中发挥作用。
中国组织工程研究杂志出版内容重点:肾移植;肝移植;移植;心脏移植;组织移植;皮肤移植;皮瓣移植;血管移植;器官移植;组织工程
目前镇痛药物主要分为中枢性镇痛药、非中枢性镇痛药及激素类药物。中枢类镇痛药主要作用于阿片受体达到镇痛,但副作用就是成瘾,主要用于强效镇痛。非中枢性镇痛药主要是非甾体药,主要通过抑制炎性介质(如白三烯、花生四烯酸等)的分泌达到镇痛。激素类药物的镇痛机制尚未完全明确,但其副作用大不能久用。现临床各类镇痛药都存在一定的不良反应,或多或少影响治疗效果。新疆阿魏主要有消炎抗菌及解痉镇痛抗溃疡作用,其镇痛作用已在临床和研究中得到证实。阿魏或许是通过抑制一氧化氮及胶质细胞的激活阻断了疼痛传导通路,从而有效缓解了大鼠坐骨神经痛。因此对此进行实验加以探讨。
中国组织工程研究杂志出版内容重点:肾移植;肝移植;移植;心脏移植;组织移植;皮肤移植;皮瓣移植;血管移植;器官移植;组织工程
| 阅读次数 | ||||||
|
全文 |
|
|||||
|
摘要 |
|
|||||