 Quantitative analysis of experimental rats and process of diabetes induction in rats
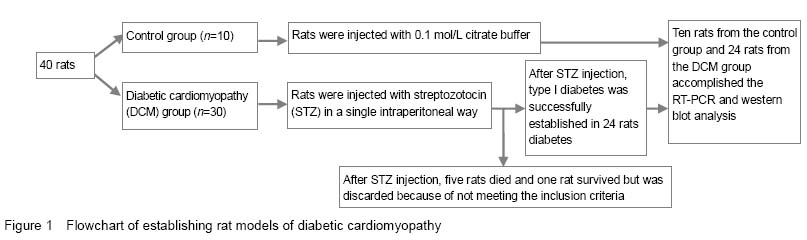
At the end of 12 weeks, 24 rats from the DCM group and 10 rats from the control group survived, and the rest five diabetic rats from the DCM group died due to infection or diabetic ketoacidosis. Unfortunately, in the DCM group, one rat was discardded because its blood glucose was normal but did not meet the standard for successful diabetes induction. Ultimately 10 rats from the control group and 24 rats from the DCM group were included in the final analysis. The rats in the control and DCM groups were all given normal diet and were allowed free access to water. Food and water intakes were closely monitored and blood flucose level was measured weekly. Experimental procedure is shown in
Figure 1.
Improvement of diabetes models
In this experiment, blood sugar level at 3 weeks after STZ injection was used as a diagnostic criterion for type 1 diabetes, which ensures the quality and stability of animal models. Male Wister rats were used to establish DCM model easily and effectively. Throughout the whole experiment, rats in the control and DCM groups were all given normal low fat diet. In addition, histopathological staining, RT-PCR, and western blot analysis were used to determine the myocardial pathological alteration of DCM clearly and credibly.
The stability of diabetes models
Injection of a large dose of STZ could damage rat pancreatic function, which ensures the efficacy of diabetes models and longer period of normal diet, leading to more severer pathological changes of type 1 diabetes. In addition, blood glucose level at 3 weeks after STZ injection as a diagnostic criterion for type 1 diabetes ensured the quality and stability of animal models.
Behavioral characteristics of rat models of diabetes
In the course of the experiment, rats from the control group were in good state of mind, whose reaction was sensitive. In addition, the body weight of rats in the control group was increased significantly and these rats had a shiny fur. The STZ-induced diabetic rats were at a diabetic state of polydipsia and polyuria with lowered body weights. Other symptoms such as hair removal, tail rot, and cataract, which are commonly associated with the diabetes complications, also appeared in the diabetic rats.
General changes of blood glucose levels
Before the STZ injection, there was no significant difference in blood glucose level in rats between the control and DCM groups (P > 0.05). Blood glucose levels were significantly increased in STZ-induced diabetic rats compared to those in rats of the control group (P < 0.05; Table 1).
 Pathological variations of cardiac tissue
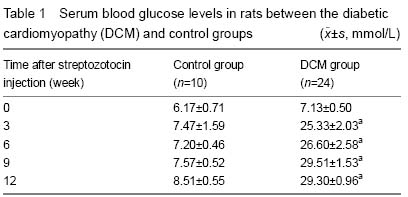
Through light microscopy, it was observed that the diabetic rats had increased sizes and disordered arrangement of cardiocytes compared to those in rats of the control group after 12 weeks of diabetes. Masson’s trichrome staining of rat myocardium showed that the cardiac collagen deposition in the STZ-induced diabetic
rats was dramatically increased and spread over the surrounding myocardial cells and blood vessels,
compared to that in rats of the control group (
Figure 2).
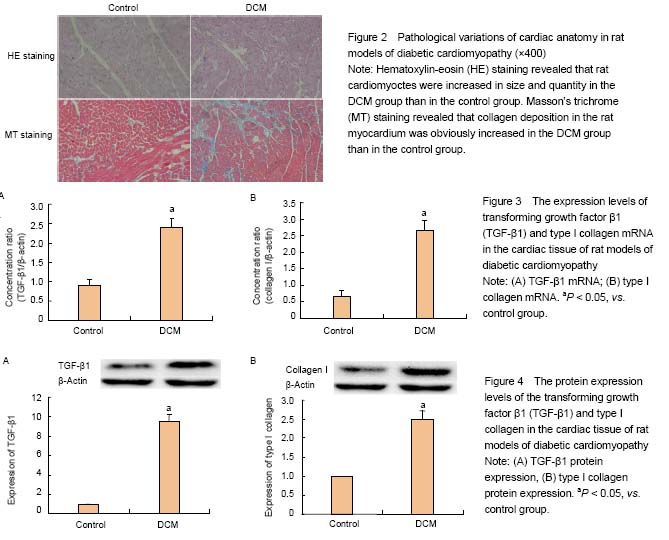
Myocardial expression of TGF-β1 and type I collagen
TGF-β1 and type I collagen were regarded as a marker reflecting the activation of cardiac fibrosis[13-16]. The mRNA and protein expression levels of TGF-β1 and type I collagen , which were measured by RT-PCR (
Figure 3) and western blot analysis (
Figure 4) respectively, were markedly higher in the DCM group than in the control group.