Design
A cytological observation.
Time and setting
The experiment was conducted in the
Daqing Longnan Hospital from January 2012 to October 2013.
Materials
4-8 week-old male SPF Sprague Dawley rats, weighing 200-250 g, were purchased from the Animal Experimental Center of Mudanjiang Medical University, China (SCXK(Hei)2006-010). All animals received humane care in compliance with the Guide for the Care and Use of Laboratory Animals published by the U.S. National Institute of Health (NIH Publication No. 85–23, revised 1996).
Methods
Isolation, culture, and identification of BMSCs
BMSCs were isolated, cultured and identified by using the methods as previous reports[11-13]. Briefly, the animals were killed after anesthetized with ether, and were immersed in iodophor for 15-20 minutes. BMSCs were isolated by flushing the cavity of femurs and tibias and transferred to a tissue culture dish 90 mm in diameter (BD Biosciences, Franklin Lakes, NJ, USA). The isolated bone marrow cells were then cultured and expanded in low glucose culture containing Dulbecco’s modified Eagle’s medium/F-12(LG-DMEM; Gibco, Invitrogen, CA, USA), supplemented with 10% fetal bovine serum (Hyclone, Logan, UT, USA), 100 U/mL penicillin and 100 g/mL streptomycin (Sigma). When adherent cells were confluent (defined as passage 0), they were continuously cultured until passages 3 to 5 using trypsin (0.25%)/
1 mmol/L ethylenediamine-tetraacetic acid (EDTA; Sigma) for 5 minutes. All culture experiments in this study were maintained in 5% humidified CO2 at 37 ℃ and the cultures were replenished with fresh medium every 3 days. For immunophenotyping analysis, cells were washed twice with PBS containing 0.5% bovine serum albumin (BSA, Sigma), then suspended in PBS and incubated with primary against human CD34, Flk1 (Santa Cruz Biotechnology, Santa Cruz, CA, USA), CD45 and CD31 (BD Biosciences) for 30 minutes at 4 ℃. The second polyclonal antibody was added and the samples were incubated at 4 ℃ for an additional 30 minutes in a dark room. The same isotype irrelevant antibody of the same species was used as negative control. After being washed, cells were resuspended in PBS for fluorescence activated cell sorting (FACS) analysis.
AMI model and stem cell transplantation
A rat model of AMI was generated by ligating the left anterior descending artery (LAD) with the detail reported before[14-19]: under general anesthesia, animals were intubated and positive pressure ventilation was maintained. The mid third of the LAD was ligated after three intermittent brief preconditioning occlusions, each for 5 minutes. A bolus dose of lignocaine was given intravenously (1 mg/kg) and was then maintained at
1 mg/min/kg by intravenous dripping. Subsequently, the eligible animals were randomly divided into model group and BMSCs group (10 in each group). For the BMSCs group, after coronary ligation, cells (1×10⁷) in 100 μL saline were subsequently injected with a sterile microinjection via the tail vein[20-28]. Hemostasis was performed and the chest was closed in layers. Postoperatively, penicillin G benzathine (30 000 U/d) was given intravenously for 3 days.
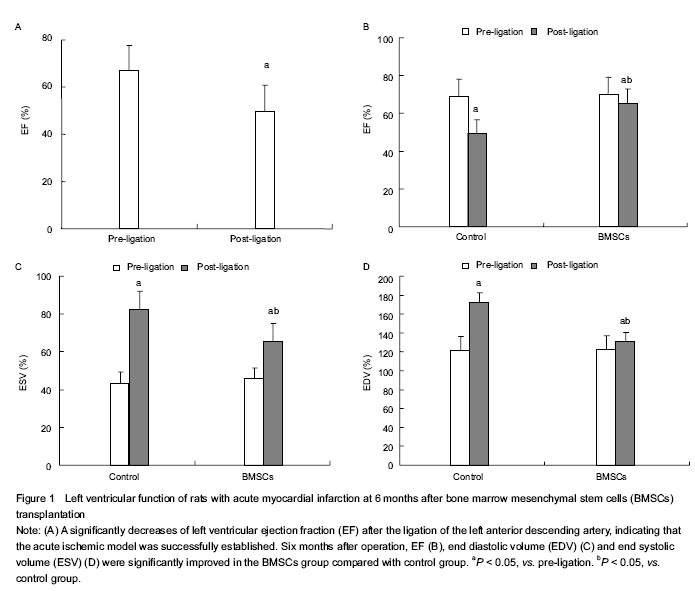
Left ventricular function analysis
Left ventricular function was analyzed as previously described[28-33]. Six months after the cells were injected, the rats were anesthetized and inserted with a 3F-Miller microtip catheter via the right jugular vein into the right ventricle to obtain base line measurements of end diastolic volume (EDV), end systolic volume (ESV), and ejection fraction (EF).
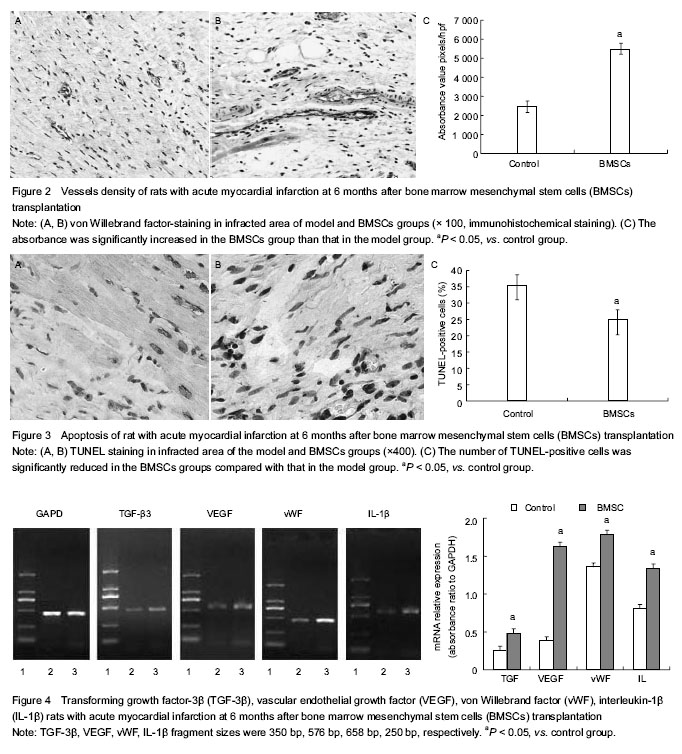
Immunohistochemical staining analysis of vessel density in infarcted zone of rat myocardium
Six months after the cells were injected, under general anesthesia, the hearts were quickly harvested and the tissues in infarcted zone were collected and fixed with 10% formaldehyde. Myocardial density (MD) was quantified with an Image Pro plus (IPP) 6.0 software package (IPP, Media Cybernetics, Maryland, USA) [34-40]. To evaluate the effect of combined therapy on angiogenesis, slices in each group were stained with rabbit anti-human von Willebrand factor (vWF) antibody (Dako Cytomation, CPH, Denmark). The vascular density was counted with an Image Pro plus (IPP) 6.0 software packages in five non-overlapping fields (100 × magnification). Positively stained areas were padded with a single color and converted to pixels through absorbance (A) calibration. Survival of the transplanted BMSCs was demonstrated by observing the presence of green fluorescent protein-labeled cells.
Terminal dUTP nick end-labeling staining (TUNEL) detected apoptosis in infarcted zone of rat myocardium
Six months after the cells were injected, TUNEL method was performed to detect the cell apoptosis in infarction zone according to the In Situ Cell Death Detection Kit (Roche Applied Science, Mannheim, Germany)[41-48]. Briefly, deparaffinized 5-μm-thick slices were incubated at 37 ℃ for 1 hour with 50 μL TUNEL-reaction mixture (including 5 μL terminal desoxynucleotidyl-transferase (TdT) and 45 μL dUTP-biotin) after proteinase K treatment. In negative control, TdT was omitted, and positive controls were pre-treated with DNAse A. Slices were visualized and photographed by Olympus BX41 microscope (Olympus America Inc., Center Valley, PA, USA) equipped with digital camera. TUNEL-positive cells were observed under a microscope (200×magnifications).
Reverse transcription (RT)-PCR detected mRNA expression of VEGF, vWF, transforming growth factor-β3 (TGF-β3) and interleukin-1β (IL-1β) in infarcted zone of rat myocardium
After the hearts were harvested and total RNA was extracted from cardiac tissue with Trizol (Invitrogen, CA, USA), RT-PCR analysis was performed to detect the relative expression levels of VEGF, vWF, TGF-β3, and IL-1β 6 months after operation as previously described[49-52]. GAPDH was used as an internal control for the amount of RNA input. After RT-PCR, 1% agarose gel electrophoresis was performed and the UVIpro gel documentation system (UVIpro, UVI, UK) was used for semi-quantization analysis of each PCR product.
Main outcome measures
The pathological and physiological changes of myocardial tissues were observed.
Statistical analysis
Statistical analysis was carried out by using the SPSS 13.0 software (SPSS, USA). Paired Student’s t-test was used for self-comparison. Independent two-samples Student’s t-test was used to compare experimental measurements between two groups. Data were expressed as mean±SD and considered statistically significant at a value of P < 0.05.