中国组织工程研究 ›› 2013, Vol. 17 ›› Issue (25): 4601-4608.doi: 10.3969/j.issn.2095-4344.2013.25.006
• 组织工程口腔材料 tissue-engineered oral materials • 上一篇 下一篇
氧化锆及4种全冠修复材料磨耗性能的对比
王 军1,王明臻2,王万春2,扬 梅2
- 1青岛大学医学院,山东省青岛市 266021
2青岛市口腔医院,山东省青岛市 266001
-
收稿日期:2013-03-15修回日期:2013-04-15出版日期:2013-06-18发布日期:2013-06-18 -
通讯作者:王万春,教授,青岛市口腔医院,山东省青岛市 266001 -
作者简介:王军★,男,1984年生,山东省临沂市人,汉族,青岛大学医学院在读硕士,主要从事口腔修复学研究。
Wearing ability of zirconia and four kinds of full crown repair materials: Comparative study
Wang Jun1, Wang Ming-zhen2, Wang Wan-chun2, Yang Mei2
- 1 Qingdao University Medical College, Qingdao 266021, Shandong Province, China
2 Stomatological Hospital of Qingdao City, Qingdao 266001, Shandong Province, China
-
Received:2013-03-15Revised:2013-04-15Online:2013-06-18Published:2013-06-18 -
Contact:Wang Wan-chun, Professor, Stomatological Hospital of Qingdao City, Qingdao 266001, Shandong Province, China -
About author:Wang Jun★, Studying for master’s degree, Qingdao University Medical College, Qingdao 266021, Shandong Province, China
摘要:
背景:氧化锆陶瓷是近年来新兴的一种口腔修复材料,因其美观性及生物相容性好而受到患者的欢迎,但目前关于其与对颌天然牙磨耗性能方面的研究较少。 目的:观察氧化锆与其他4种临床常用的全冠修复材料与滑石瓷对磨时对其造成的体积损失量,并与天然牙比较,研究氧化锆及另外4种修复材料的磨耗差异。 方法:将氧化锆陶瓷,vita陶瓷,金钯合金,镍铬合金,钴铬合金及对照组天然牙釉质作为上试件,分别安装于磨耗机上部夹具中,将滑石瓷作为下试件,分别安装于磨耗机下部夹具中,在人工唾液环境下进行加载磨耗实验,计算上下试件的体积损失量;使用纤维硬度测试仪对上述试件进行硬度测试;扫描电镜下观察试件表面磨耗形态。 结果与结论:5种材料所致的滑石瓷体积损失量均大于对照组滑石瓷体积损失量 (P < 0.05);氧化锆陶瓷硬度值最高,自身及对磨滑石瓷体积损失量最大;金钯合金硬度值最小,自身及对磨滑石瓷体积损失量最接近天然牙;5种材料的硬度与其导致的对磨滑石瓷体积损失量呈显著正相关 (P < 0.05)。氧化锆及vita陶瓷主要为磨粒磨损,表面沟裂突起样结构明显、磨耗犁沟深、形态不规则,磨耗面可见散在气孔结构。钴铬合金磨耗面相对光滑,表面磨耗犁沟较浅,磨耗面散在金属磨粒;镍铬合金磨耗犁沟深而宽,磨耗面存在大量金属磨粒;金钯合金磨耗犁沟均匀分布,偶见剥脱斑块,斑块内金属磨粒附着。表明氧化锆陶瓷在临床中容易造成对颌天然牙的过度磨耗,永久黏固前应对其进行精细抛光;金钯合金的磨耗性能与天然牙最接近且最优,是较好的后牙区全冠修复材料;口腔修复材料的硬度值不能代表其磨耗性能大小,应综合考虑材料表面的微观结构等因素,采取措施发挥各种材料优势。
中图分类号:
引用本文
王 军,王明臻,王万春,扬 梅. 氧化锆及4种全冠修复材料磨耗性能的对比[J]. 中国组织工程研究, 2013, 17(25): 4601-4608.
Wang Jun, Wang Ming-zhen, Wang Wan-chun, Yang Mei. Wearing ability of zirconia and four kinds of full crown repair materials: Comparative study[J]. Chinese Journal of Tissue Engineering Research, 2013, 17(25): 4601-4608.
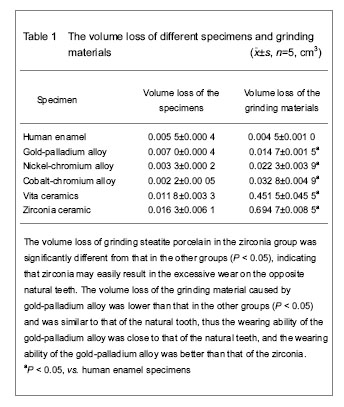
Hardness values of different specimens
Correlation analysis between the hardness of different specimens and volume loss of grinding steatite porcelain (Figures 1, 2)
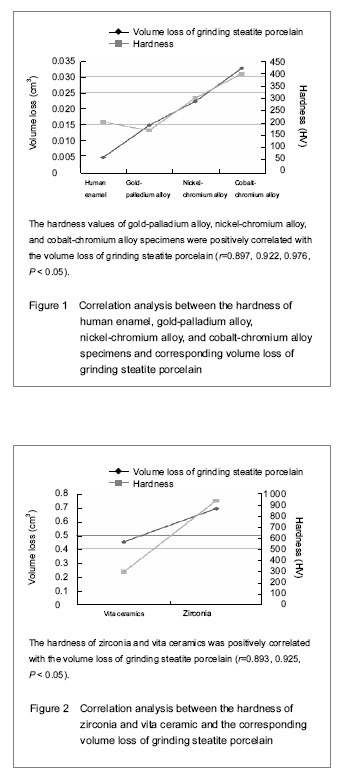
The hardness values of gold-palladium alloy, nickel-chromium alloy, and cobalt-chromium alloy specimens were positively correlated with the volume loss of grinding steatite porcelain (r=0.897, 0.922, 0.976, P < 0.05), indicating the higher the hardness, the larger the volume loss. The hardness of zirconia and vita ceramics was also positively correlated with the volume loss of grinding steatite porcelain (r=0.893, 0.925, P < 0.05).
Correlation analysis between the wear morphology and wear performance of different specimens (Figures 3, 4)
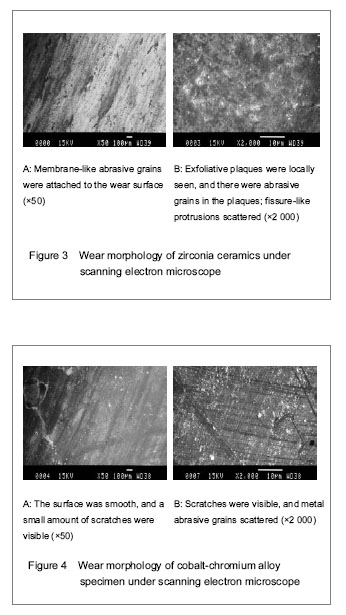
There are abrasive wear, surface fatigue, adhesive wear, and erosive wear. By observing and analyzing the wear morphology of the specimens, we can understand the wear mechanisms of different materials and natural teeth.
There were regular scratches and furrow-like structures, arranging orderly, on the surface of metal materials. Exfoliative plaques scattered on the wear surface. Under the high-powered electron microscope, exfoliative plaques exhibited irregular shape and local plastic deformation, and metal abrasive grains were seen adherent to the wear surface. It could be seen that adhesive wear and abrasive wear happened on the metal materials. The protrusion structure on the wear surface led to the force deformation, and some parts with low shear strength were avulsed during friction movement, thereby resulting in the occurrence of adhesive wear. Abrasive wear occurred because the materials undergoing a long-term friction appeared to have fatigue cracks and form exfoliative plaques, some metal abrasive grains formed and were pressed again into the wear surface resulting in furrow formation caused by the secondary friction. By comparing the images, we found that the wear degree of different metal specimens ranked as follows: cobalt-chromium alloys < nickel-chromium alloy < gold-palladium alloy. Based on the hardness analysis, we also found that the higher the hardness, the milder the wear.
| [1] Xu JW. Prosthodontics. 3rd ed. Beijing: People's Medical Publishing House, 1994.[2] Fujii K, Carrick TE, Bicker R, et al. Effect of the applied load on surface contact fatigue of dental filling materials. Dent Mater. 2004;20(10):931-938.[3] Lambrechts P, Debels E, Van Landuyt K, et al. How to simulate wear? Overview of existing methods. Dent Mater. 2006;22(8):693-701.[4] Deng M, Su XM. Application of silicone rubber materials in repair of complete denture. Zhongguo Zuzhi Gongcheng Yanjiu yu Linchuang Kangfu. 2010;14(25):4645-4648.[5] Alien PF, McMiIlan AS. A longitudinal study of quality of life outcomes in older adults requesting implant prostheses and complete removable dentures. Clin Oral Implants Res. 2003;14(2):173-179.[6] Gong L, Xiao H. Friction properties of different dental restorative materials and their influential factors. Zhongguo Zuzhi Gongcheng Yanjiu yu Linchuang Kangfu. 2010; 14(29):5423-5426.[7] Turssi CP, Ferracane JL, Vogel K. Filler features and their effectson wear and degree of conversion of particulate dental resin composites. Biomaterials. 2005;2(624): 4932-4937.[8] Gao QP. Friction and Wear Behavior of Natural Tooth and Dental All-ceramic Veneering Porcelain. Xian: Xian Jiaotong Daxue, 2007.[9] Hudson JD, Georgescu M. Enamel wear caused by three different restorative materials. J Prosthetic Dent. 1995; 72(5):647-654.[10] Ghazal M, Yang B, Ludwig K, et al. Two-body wear of resin and ceramic denture Teeth in comparison to human enamel. J Dent Mater. 2008;24(4):502-507.[11] Vult von Steyern P. All-ceramic fixed partial dentures. Studies on aluminum oxide- and zirconium dioxide-based ceramic systems. Swed Dent J Suppl. 2005;(173):1-69.[12] Quinn JB, Sundar V, Lloyd IK. Influence of microstructure and chemistry on the fracture toughness of dental ceramics. Dent Mater. 2003;18(7):603-611.[13] Graf K, Johnson GH, Mehl A, et al. The influence of dental alloys on three body wear of human enamel and dentin in an inlay-like situation. Oper Dent. 2002;27(2):167-174.[14] Elmaria A, Goldstein G, Vijayaraghavan T, et al. An evaluation of wear when enamel is opposed by various ceramic materials and gold. J Prosthet Dent. 2006; 96(5): 345-353.[15] Li H, Zhou ZR, Zhang J, et al. Comparative study of the friction and wear behavior of natural tooth and several dental prosthetic materials. Mochaxue xuebao. 2001; 21(3): 172-175.[16] Ohkubo C, Shimura I, Aoki T, et al. Wear resistance of experimental Ti- Cu alloys. Biomaterials. 2003;24(20): 3377-3381.[17] Sturdevant JR, Lundeen TF, Sluder TB Jr, et al. Three-year study of two light-cured posterior composite resins. Dent Mater.1986;2(6): 263-268.[18] Peter S, Delong R, Pintado MR, et al. Comparison of two measurement techniques for clinical wear. J Dent. 1999; 27(7):479-485.[19] Kumagai H, Suzuki T, Hamada T, et al. Occlusal force distribution on the dental arch during various levels of clenching. J Oral Rehabil. 1999;26(3):932-935.[20] Wassell RW, McCabe JF, Walls AW. Wear rates of regular and tempered composites. J Dent. 1997;25:49-52.[21] Ma JP, Yao YL, Song YL, et al. Weariness of enamel opposing to dental porcelains. Shiyong Kouqiang Yixuezazhi. 2001;17(3):206-208.[22] Folwaczny M, Mehl A, Kunzelman KH, et al. Determination of changes on tooth-colored cervical restorations in vivo using a three-dimensional laser scanning device. Eur J Oral Sci. 2000;108(3):233-238.[23] Heintze SD, Zellweger G, Cavalleri A, et al. Influence of the antagonist material on the wear of different composites using two different wear simulation methods. J Dent Mater. 2006;22(2):166-175.[24] Harrison A. Wear of combinations of acrylicresin and porcelain on an abrasion testing machine. J Oral Rehabil. 1978;5(2):111-115.[25] Sajewicz E. On evaluation of wear resistance of tooth enamel and dental materials. Wear. 2006;260(4): 1256-1261.[26] Seghi RR, Rosenstiel SF, Bauer P. Abrasion of human enamel by different dental ceramics in vitro. J Dent Res. 1991;70:221-225.[27] Magne P, Oh WS, Pintado MR, et al. Wear of enamel and veneering ceramics after laboratory and chairside finishing procedures. J Prosthet Dent. 1999;82:669-679.[28] Metzler KT, Woody RD, Miller AW 3rd, et al. In vitro investigation of the wear of humane namel by dental porcelain. J Prosthet Dent. 1999;81:356-364.[29] Jacobi R, Shillingburg HT, Duncanson MG. A comparison of the abrasiveness of six ceramics and gold. J Prosthet Dent. 1991;66:303-309.[30] Hacker CH, Wagner WC, Razoog ME. An in vitro investigation of the wear of enamel on porcelain and gold in saliva. J Prosthet Dent. 1996;75:14-17.[31] Al-Hiyasat AS, Saunders WP, Sharkey SW. Investigation of human enamel wear against four dental ceramics and gold. J Dent. 1998;26:487-495.[32] Ramp MH, Suzuki S, Cox CF, et al. Evaluation of wear: enamel opposing three ceramic materials and a gold alloy. J Prosthet Dent. 1997;77(5):52-55. |
| [1] | 孙 启, 周亚男, 董 鑫, 李 宁, 颜家振, 石浩江, 许 胜, 张 幖. 激光选区熔化钴铬烤瓷合金金瓷结合界面的特性[J]. 中国组织工程研究, 2021, 25(4): 521-525. |
| [2] | 李 黎, 马 力. 磁性壳聚糖微球固定化乳糖酶及其酶学性质[J]. 中国组织工程研究, 2021, 25(4): 576-581. |
| [3] | 刘 鋆, 杨 龙, 王伟宇, 周玉虎, 吴 颖, 卢 涛, 舒莉萍, 马敏先, 叶 川. 聚3-羟基丁酸酯4-羟基丁酸酯/聚乙二醇/氧化石墨烯组织工程支架的制备和性能评价[J]. 中国组织工程研究, 2021, 25(22): 3466-3472. |
| [4] | 程亚楠, 吴毓聪, 毛秋华, 陈 灵, 陆丽英, 徐 普. 渗透树脂联合生物活性玻璃修复脱矿牙釉质的效果及稳定性[J]. 中国组织工程研究, 2021, 25(22): 3522-3526. |
| [5] | 周安琪, 唐渝菲, 吴秉峰, 向 琳. 骨膜组织工程设计:共性与个性的结合[J]. 中国组织工程研究, 2021, 25(22): 3551-3557. |
| [6] | 郎丽敏, 何 生, 姜增誉, 胡奕奕, 张智星, 梁敏茜. 导电复合材料在心肌梗死组织工程治疗领域的应用进展[J]. 中国组织工程研究, 2021, 25(22): 3584-3590. |
| [7] | 马 晴, 施丽燕, 黄思雪, 郑章博文, 张爱华, 战德松, 付佳乐. 氧化锆陶瓷在牙体修复领域的研究现状及展望[J]. 中国组织工程研究, 2021, 25(22): 3597-3602. |
| [8] | 鲍赛荣, 林利华, 单莎瑞, 杨杏萍, 刘春龙. 电动深层肌肉刺激对脑卒中患者肱二头肌张力、弹性及硬度的影响[J]. 中国组织工程研究, 2021, 25(20): 3138-3143. |
| [9] | 解 健, 苏俭生. 静电纺丝取向纳米纤维作为组织工程生物支架的优势与特征[J]. 中国组织工程研究, 2021, 25(16): 2575-2581. |
| [10] | 纪 琦, 喻正文, 张 剑. 3D打印金属基生物材料工艺和临床应用的问题与趋势[J]. 中国组织工程研究, 2021, 25(16): 2597-2604. |
| [11] | 宋涯含, 吴云霞, 范道洋. 基于VOSviewer生物医学领域3D打印的知识图谱分析[J]. 中国组织工程研究, 2021, 25(15): 2385-2393. |
| [12] | 钱楠楠, 张 潜, 杨 睿, 敖 俊, 章 涛. 间充质干细胞治疗脊髓损伤:细胞治疗及联合新药和生物材料[J]. 中国组织工程研究, 2021, 25(13): 2114-2120. |
| [13] | 罗雅馨, 毕浩然, 陈晓旭, 杨 琨. 细胞外基质与组织的再生与修复[J]. 中国组织工程研究, 2021, 25(11): 1785-1790. |
| [14] | 贾 巍, 张满栋, 陈维毅, 王晨艳, 郭 媛. 股骨假体材料对人工膝关节置换性能的影响[J]. 中国组织工程研究, 2021, 25(10): 1477-1481. |
| [15] | 王 倩, 李 璐, 舒静媛, 董志恒, 靳友士, 王青山. 氧化锆基纳米羟基磷灰石功能梯度生物材料的微观形貌和物相分析[J]. 中国组织工程研究, 2021, 25(10): 1517-1521. |
Design
1 实验使用摩擦磨损实验机模拟口腔咀嚼运动及咀嚼环境,在人工唾液环境中观察氧化锆和天然牙耐磨性的相似度,及与另外4种修复材料之间的磨耗性能差异。 2 结果表明氧化锆陶瓷在临床中容易造成对颌天然牙的过度磨耗,永久黏固前应对其进行精细抛光;金钯合金的磨耗性能与天然牙最接近且最优,是较好的后牙区全冠修复材料;口腔修复材料的硬度值不能代表其磨耗性能大小,应综合考虑材料表面的微观结构等因素,采取措施发挥各种材料优势。 3 使用体外实验方式分析了氧化锆及4种全冠修复材料的磨耗性能,未能就不同抛光程度的氧化锆磨耗性能区别做进一步研究。
氧化锆造成的对磨滑石瓷体积损失量大于3组金属材料所造成的滑石瓷体积损失量(P<0.05),原因是实验中发现在金属材料对磨滑石瓷表面有大量金属磨粒附着形成金属薄膜,这层薄膜可作为两种材料间的润滑膜,减缓了金属材料及滑石瓷之间的磨耗,而陶瓷材料颗粒硬度较高,磨削下的颗粒无法在表面形成薄膜,不能产生介质保护效应,加之瓷层表面出现脆性断裂进而形成尖窝点隙,造成了对磨滑石瓷的大量磨耗。 在贵金属中,目前大多数学者认为金合金抗磨耗的性能好于陶瓷材料,磨耗性能最接近天然牙釉质,其对天然牙釉质的磨耗小于陶瓷材料及非贵金属,实验中使用的金钯合金属于低贵金属合金,目前认为其在理化性能及技工加工性能方面均适宜代替贵金属金合金。实验数据显示金钯合金自身体积损失量与天然牙最接近,对磨滑石瓷体积损失量小于其余各组材料所造成的损失量,其磨耗性能优于各组材料,进一步证明了金钯合金在磨耗性能方面可代替金合金的理论。大多学者认为非贵金属材料可造成对颌天然牙的非正常磨耗。实验选用的镍铬合金、钴铬合金属于非贵金属,其自身磨耗量小于金钯合金(P<0.05),而造成滑石瓷的体积损失量大于金钯合金(P<0.05),相对金钯合金更容易造成对颌天然牙的过度磨耗。 实验数据示金属试件中钴铬合金硬度值最高导致的滑石瓷体积损失最多,金钯合金硬度值最小导致的滑石瓷体积损失量最少,镍铬合金硬度值和滑石瓷体积损失量居中。经相关性分析得出,3种金属材料的硬度值与导致的滑石瓷体积损失呈正相关,证实了金属材料硬度与磨耗性能呈正相关的理论。
| 阅读次数 | ||||||
|
全文 |
|
|||||
|
摘要 |
|
|||||