Design
A randomized controlled animal experiment.
Time and setting
The experiment was completed in Guangdong Medical College between December 2008 and July 2009.
Animals
Forty-four female Kunming mice, aged 2 months old, weighing (25.8±2) g, were provided by the Laboratory Animal Center, Guangdong Medical College. Prior to experimentation, all mice were fed for 3 days to acclimate.
Main instruments and reagents
LeicaRm-2135 LEICA RM 2135 rotary microtome, computer image digital analysis system, FluorChem SP chemiluminescent gel image analysis system, ABI PRISM® 7300 fluorescence quantitative PCR Instrument, and B×51 fluorescent microscope were used in this study. Ganoderma lucidum polysaccharide was provided by the Hubei Provincial Research Institute of Microbiology and Sino-German Baoding Shidake Bioengineering Co., Ltd., China. Vitamin E was provided by the Medical Science and Technology Development Center, Guangdong Medical College, China. D-galactose was purchased from Shanghai Second Reagent Factory, China. Superoxide dismutase was purchased from Nanjing Jiancheng Bioengineering Research Institute, China. Power SYBR Green PCR two-step kits were sourced from ABI, USA.
Preparation of medicine and reagents
A total of 31.5 g D-galactose was dissolved in 250 mL physiological saline to prepare 12.5% D-galactose solution; 1 g sodium carboxymethyl cellulose and 5 mL 100% pure Vitamin E oil were triturated, and distilled water was added to 100 mL to prepare 5% vitamin E oil.
Methods
Group management and medication
Forty-four mice were randomly and evenly divided into four groups: normal control group (one mouse died), aging model group, vitamin E group, and Ganoderma lucidum polysaccharide group. All mice had freely available food and water. All mice received daily subcutaneous injection (in the nape area) or intragastric administration as follows: normal control group: 1 000 mg/kg physiological saline+250 mg/kg physiological saline; aging model group: 1 000 mg/kg 12.5% D-galactose solution+250 mg/kg physiological saline; vitamin E group: 1 000 mg/kg 12.5% D-galactose solution+250 mg/kg 5% vitamin E oil; Ganoderma lucidum polysaccharide: 1 000 mg/kg 12.5% D-galactose solution+250 mg/kg Ganoderma lucidum polysaccharide. All administrations were performed under sterile conditions. After 42 days, all mice were sacrificed by decapitation. An area of 0.5 cm×0.5 cm back skin was harvested, fixed in 10% neutral formalin, and sliced into sections for morphologucal observation and quantitative analysis. The remaining back skin was washed in double distilled water, dried, frozen in liquid nitrogen, and stored at -70 ℃. Tissue homogenate was used to determine the superoxide dismutase activity and CuZn-superoxide dismutase mRNA expression.
Preparation of 10% tissue homogenate
Following back hair shaving, a 0.5 g skin block was taken and washed with pre-cooled physiological saline. Following removal of connective tissues (subcutaneous fat included), skin was dried and weighted. The skin block and pre-cooled physiological saline (nine times volume of tissue block) were made into 10% tissue homogenate using a homogenizer. Freeze-thawing in iced water was run into triplicate to thoroughly disrupt cells.
Hematoxylin-eosin staining [5]
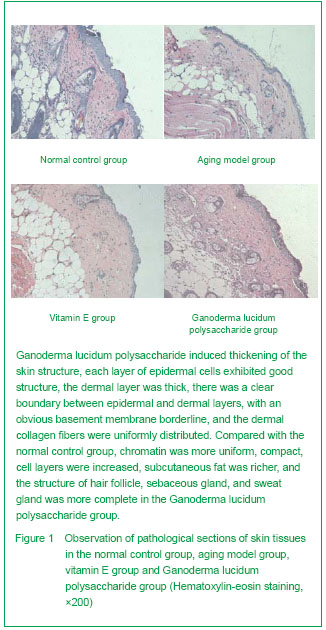
Paraffin sections were stained by hematoxylin-eosin to observe skin structure under a fluorescent optical microscope. Digital analysis was performed on five randomly selected visual fields from each section to determine the average epidermal and dermal thicknesses.
Determination of skin biochemical indicators
Superoxide dismutase activity was determined following the manufacturer’s instructions. The calculation formula is as follows:
Superoxide dismutase activity in tissue homogenate (U/mg prot)=(absorbancecontrol tube-absorbancetest tube)/absorbancecontrol tube÷50%×total volume of reaction solution/sample solution (mL) ÷ protein level in the tissue homogenate (mg prot/mL)
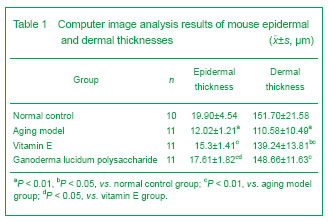
CuZn-superoxide dismutase mRNA expression
Isolation and identification of total RNA: following the manufacturer’s instructions for Trizol reagent kits, absorbance at 260 nm and 280 nm was determined using an ultraviolet spectrophotometer to determine RNA purity.
Reverse transcription reaction: The first strand reaction was performed according to the manufacturer’s instructions of PrimeScript™ reverse transcription-PCR kits provided by Takara Biotechnology (Dalian) Co., Ltd., China. Total reaction volume was 20 μL. Three parallel tubes were designated for each sample.
Primer design and synthesis: Primer sequences are as follows:
CuZn-superoxide dismutase (amplified size 252 bp)
Upstream primer: 5’-CCAGTGCAGGACCTCATTTT-3'
Downstream primer: 5’-TCCCAGCATTTCCAGTCTTT-3'
Internal control: β-actin (amplified size 211 bp)
Upstream primer: 5' AGG CCA ACC GCG AGA AGA TG 3'
Downstream primer: 5' CGG CCA GCC AGG TCC AGA 3'
Quantitative reaction: Power SYBR® Green PCR Master Mix and reverse transcription-PCR two-step kits were used for quantitative PCR, using 5 μl cDNA as template and β-actin as internal control. The PCR reaction system (50 μL) contained 20 μmol/L upstream, downstream primers (each 3 μL), mixture (25 μL), and tri-distilled water (added till 50 μL).
.jpg)
Following PCR, the data were statistically processed using an ABI 7300 system (v1.4) using the cycle threshold value method. The cycle threshold value represented the cycle number in quantitative PCR at which the fluorescence generated within a reaction well exceeded the defined threshold. There was a linear relationship between the cycle threshold value and the log of template gene copies, according to the formula: cycle threshold=[cycle threshold CuZn-superoxide dismutase mRNA-cycle threshold β-actin]tested sample-[cycle threshold CuZn-superoxide dismutase mRNA-cycle threshold β-actin]corrected sample, CuZu-superoxide dismutase mRNA expression 2-△△cycle threshold
Statistical processing
All data were statistically processed using SPSS 13.0 software (SPSS, Chicago, IL, USA) and were expressed as Mean±SEM. One-way analysis of variance was used for comparisons. Homogeneity of variance was adopted for pair wise comparison among the means. The Bonferroni method was adopted for equal population variances and Tamhane’s T2 test for unequal population variances. The significance critical level was set at α=0.05, with P < 0.05 considered significant.