Design
Imaging trial.
Time and setting
CT data were collected from the Department of Radiology, the Affiliated Hospital of Inner Mongolia Medical University from January 2014 to December 2016.
Subjects
Twenty-one adolescents, 10 males and 11 females with the age of 12-14 years
old,were randomly selected from the Affiliated Hospital of Inner Mongolia Medical University and the Second Hospital of Ulanqab.
Inclusion criteria
No history of cervical surgery.
Exclusion criteria
Congenital malformation of the cervical vertebrae, cervical tumor, or cervical tuberculosis.
The experiment has been approved by the Ethic Committee of the Affiliated Hospital of Inner Mongolia Medical University (No. 20160221). All patients signed the informed consent prior to the trial.
Methods
CT data
All CT data were obtained by a 64-slice spiral CT scanner (General Electric, USA). The following scan parameters were used: slice thickness 1.25 mm, pitch 0.921, slice gap 0.5 mm, current 250 mA, voltage 120 kV, bone window; 200-250 slices were scanned for each patient.
3D reconstruction platform: Mimics 16.01 software (Materialse, University of Leuven, Belgium); computer: IBM Lenovo ThinkStation graphic workstation D30 4223-DE5 E5-2620 2*2G 500 G RAMBO WIN7P-64 with a SAS control module.
3D reconstruction
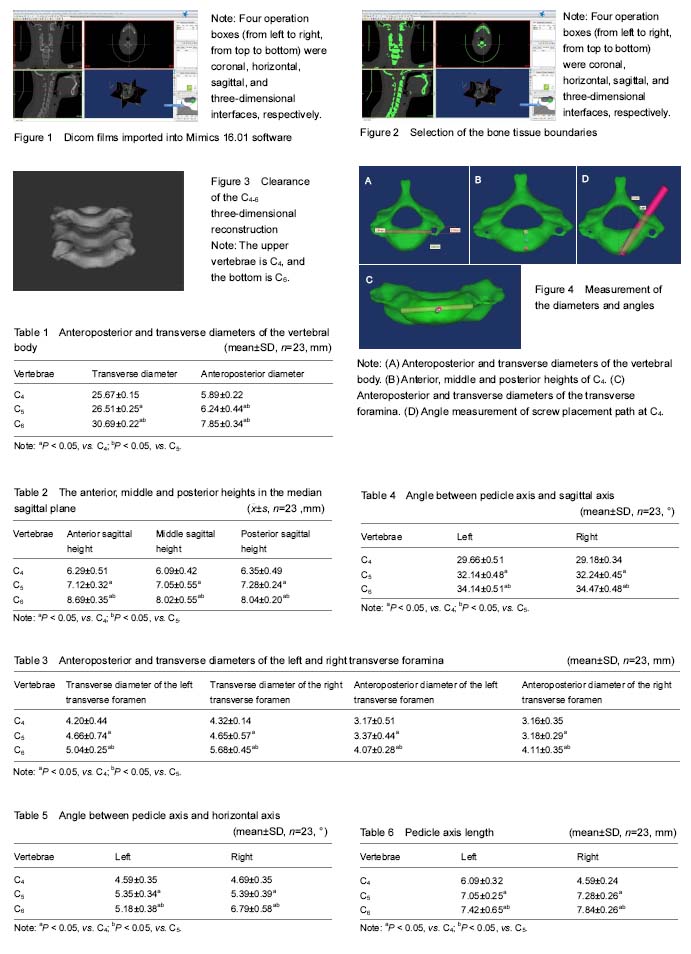
Eligible CT data were stored in DICOM format in a hard disk. Mimics16.01 software was opened, and the “import image” button in FILE sequence was clicked to import DICOM files. Before importing, four directions: anterior, posterior, left, and right were selected through three cross sectional images. After the directions were confirmed, the “Convert” button below was clicked to enter the formal image operation interface. Four operation boxes (from left to right, from top to bottom) were coronal, horizontal, sagittal, and 3D interfaces, respectively (Figure 1). The shortcut key “Thresholding” was selected to set the gray value of bone scintigraphy. The gray value was between 226 and 3 071. The “Region growing” button was clicked to apply a green mask to the bone in the image. A green mask was applied to all areas within the gray-value range in all images (Figure 2). Next, the “Edit masks” button was clicked to manually modify the bone tissue boundaries in each slice by comparing with the three different sections, to wipe soft tissue images with a high gray value, and to fill mask cavities caused by cancellous bone. Then, “Calculated 3D” was selected to superpose and reconstruct the plane mask. After reconstruction, the “smoothing” button in the tool sequence was clicked to obtain clear images of C4-6 (Figure 3).
Measurement methods
In order to measure the diameter, an established screw model was imported into the C4-6 vertebrae model using the transparency function of the software. Next, the position and size of the screw model were adjusted on a two-dimensional plane from three visual angles to reach the position defined by measurement indexes. Finally, the properties of the screw model were displayed, and its diameter and length were recorded. To measure the angles, the position of screw model was adjusted using two-dimensional and 3D views. Horizontal and sagittal axes were constructed, and the angles of the screw to the two axes were measured. All measurements were performed by two physicians familiar with Mimics 16.01 software (with an experience of more than 2 years), respectively. The mean values of the measurements obtained by the two physicians were taken as the final measurements.
Observation parameter
CAD cylinder models were established using the software, and the height of the cylinder, and the position in the cervical 3D model were adjusted until met the measurement requirements. According to CAD model parameters, the following measurements were obtained. (1) Anteroposterior and transverse diameters of the vertebral body (Figure 4A): the largest distance between the left and right edges and between the anterior and posterior edges of the vertebral body; (2) vertebral heights (Figure 4B): the perpendicular midpoint distances between the anterior edges, between the opposing endplates, and between the posterior edges; (3) anteroposterior and transverse diameters of the transverse foramina (Figure 4C); (4) distance between inner edges of the left and right transverse foramina (Figure 4C); (5) angles of left and right pedicle axes to sagittal and horizontal axes, and left and right pedicle axis lengths (Figure 4D).
Statistical analysis
All data were analyzed by SPSS 13.0 software (SPSS, Chicago, IL, USA). The results were in normal distribution. The paired
t test was used to compare the differences between sides. A multiple comparison analysis of variance test was performed to compare the differences between segments.
P < 0.05 was considered significantly.
中国组织工程研究杂志出版内容重点:人工关节;骨植入物;脊柱;骨折;内固定;数字化骨科;组织工程
.jpg)
.jpg)