Chinese Journal of Tissue Engineering Research ›› 2026, Vol. 30 ›› Issue (29): 7548-7554.doi: 10.12307/2026.258
Previous Articles Next Articles
Correlation of bone mineral density assessed using quantitative CT with obesity indicators, blood pressure, platelet count, and blood lipids in perimenopausal women
Zheng Xing, Zhang Qiang, Ye Guomin, Deng Bin, Chang Sha
- Department of Medical Imaging, Guizhou Hospital of Beijing Jishuitan Hospital (Guizhou Provincial Orthopedics Hospital), Guiyang 550014, Guizhou Province, China
-
Received:2025-09-25Revised:2025-11-27Online:2026-10-18Published:2026-03-03 -
Contact:Zhang Qiang, Chief physician, Department of Medical Imaging, Guizhou Hospital of Beijing Jishuitan Hospital (Guizhou Provincial Orthopedics Hospital), Guiyang 550014, Guizhou Province, China -
About author:Zheng Xing, MS, Attending physician, Department of Medical Imaging, Guizhou Hospital of Beijing Jishuitan Hospital (Guizhou Provincial Orthopedics Hospital), Guiyang 550014, Guizhou Province, China -
Supported by:Science and Technology Innovation Project of Guizhou Provincial Orthopedics Hospital, No. GZGYCX [2022] 13 (to ZX)
CLC Number:
Cite this article
Zheng Xing, Zhang Qiang, Ye Guomin, Deng Bin, Chang Sha. Correlation of bone mineral density assessed using quantitative CT with obesity indicators, blood pressure, platelet count, and blood lipids in perimenopausal women[J]. Chinese Journal of Tissue Engineering Research, 2026, 30(29): 7548-7554.
share this article
Add to citation manager EndNote|Reference Manager|ProCite|BibTeX|RefWorks
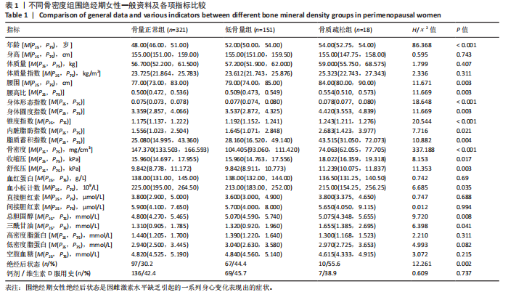
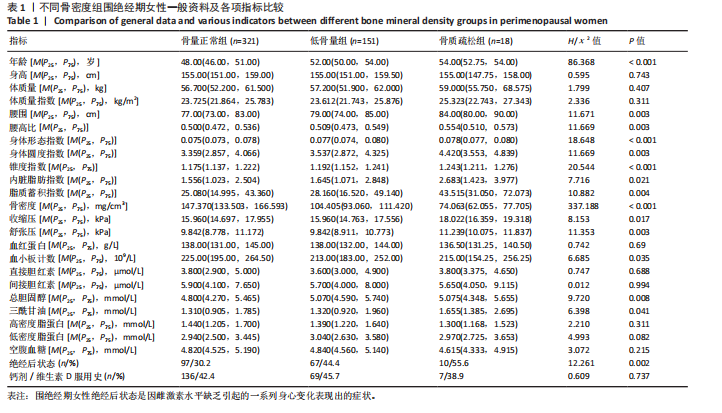
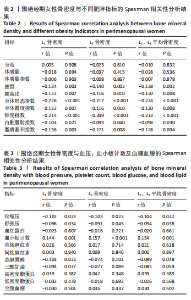
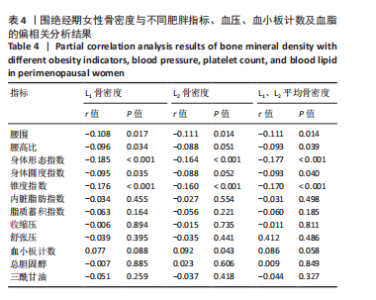
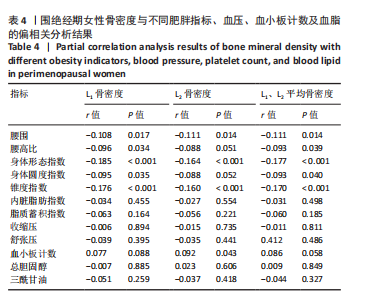
2.1 参与者数量分析 研究共纳入490例围绝经期女性,年龄45-55岁,平均年龄50.0(47.0,53.0)岁,根据L1、L2椎体骨密度平均值分为骨量正常组(n=321)、低骨量组(n=151)和骨质疏松组(n=18)。 2.2 不同骨密度组女性一般资料及各项指标比较 见表1。 3组女性间年龄、腰围、腰高比、身体形态指数、身体圆度指数、锥度指数、内脏脂肪指数、脂质蓄积指数比较差异均有显著性意义(均P < 0.05),年龄、腰围、腰高比、身体形态指数、身体圆度指数、锥度指数、内脏脂肪指数、脂质蓄积指数越大,骨密度越低。 3组女性间骨密度、收缩压、舒张压、血小板计数、总胆固醇、三酰甘油、绝经后状态比较差异均有显著性意义(均P < 0.05)。 3组女性间身高、体质量、体质量指数、血红蛋白、直接胆红素、间接胆红素、高密度脂蛋白、低密度脂蛋白、空腹血糖、钙剂/维生素D服用史比较差异均无显著性意义(P > 0.05)。 2.3 Spearman相关性分析结果 2.3.1 骨密度与不同肥胖指标的Spearman相关性分析 见表2。L1骨密度、L2骨密度、平均骨密度均与腰围、腰高比、身体形态指数、身体圆度指数、锥度指数、内脏脂肪指数、脂质蓄积指数呈负相关(P < 0.05),但L1骨密度、L2骨密度、平均骨密度均与身高、体质量、体质量指数无显著相关性(P > 0.05)。 2.3.2 骨密度与血压、血小板计数及血糖血脂的Spearman相关性分析 见表3。 L1骨密度、L2骨密度、平均骨密度均与收缩压、舒张压呈负相关(P < 0.05),与血小板计数呈正相关(P < 0.05),L1骨密度、平均骨密度均与总胆固醇呈负相关(P < 0.05),L1骨密度与三酰甘油呈负相关(P < 0.05);L1骨密度、L2骨密度、平均骨密度均与血红蛋白、直接胆红素、间接胆红素、高密度脂蛋白、低密度脂蛋白、空腹血糖无显著相关性(P > 0.05)。 2.4 偏相关分析结果 见表4。校正年龄、绝经后状态等混杂因素后,偏相关分析结果显示,L1骨密度、L2骨密度、平均骨密度仍与腰围、身体形态指数、锥度指数呈负相关(P < 0.05),L1骨密度、平均骨密度仍与腰高比、身体圆度指数呈负相关(P < 0.05),L2骨密度与血小板计数呈正相关(P < 0.05),但L1骨密度、L2骨密度、平均骨密度均与内脏脂肪指数、脂质蓄积指数、收缩压、舒张压、总胆固醇、三酰甘油无显著相关性(P > 0.05)。"
"

"
| [1] SUBARAJAN P, ARCEO-MENDOZA RM, CAMACCHO PM, et al. Postmenopausal Osteoporosis: A Review of Latest Guidelines. Endocrinol Metab Clin North Am. 2024;53(4):497-512. [2] LU B, HAN Q, ZHAO S, et al. Associations between hormones, metabolic markers, and bone mass in perimenopausal and postmenopausal women. J Bone Miner Metab. 2025;43(4):392-401. [3] VERMA A, MALHOTRA A, RANJAN P, et al. A comprehensive evaluation of predictors of obesity in women during the perimenopausal period: A systematic review and narrative synthesis. Diabetes Metab Syndr. 2024;18(1):102933. [4] PALACIOS S, CHEDRAUI P, SANCHEZ-BORREGO R, et al. Management of obesity in menopause. Climacteric. 2024;27(4):357-363. [5] URALDE ER, SOBEL TH, MANSON JE, et al. Management of perimenopausal and menopausal symptoms. BMJ. 2023;382:e072612. [6] YELLAND S, STEENSON S, CREEDON A, et al. The role of diet in managing menopausal symptoms: A narrative review. Nutr Bull. 2023; 48(1):43-65. [7] 中华医学会骨质疏松和骨矿盐疾病分会.原发性骨质疏松症诊疗指南(2022)[J].中国全科医学,2023,26(14):1671-1691. [8] 刘功稳,朱柯雨,陆政峰,等.骨质疏松症和骨质疏松性骨折防治的现状及挑战[J].中华骨质疏松和骨矿盐疾病杂志,2024,17(5): 409-418. [9] LONG G, LIU C, LIANG T, et al. Predictors of osteoporotic fracture in postmenopausal women: a meta-analysis. J Orthop Surg Res. 2023; 18(1):574. [10] HARRIS K, ZAGAR CA, LAWRENCE KV. Osteoporosis: Common Questions and Answers. Am Fam Physician. 2023;107(3):238-246. [11] CRANNEY A, WALDEGGER L, ZYTARUK N, et al. Risedronate for the prevention and treatment of postmenopausal osteoporosis. Cochrane Database Syst Rev. 2003;(4):CD004523. [12] PERDOMO CM, Cohen RV, SUMITHRAN P, et al. Contemporary medical, device, and surgical therapies for obesity in adults. Lancet. 2023; 401(10382):1116-1130. [13] CHEN R, ARMAMENTO-VILLAREAL R. Obesity and Skeletal Fragility. J Clin Endocrinol Metab. 2024;109(2):e466-e477. [14] MARTINIAKOVA M, BIRO R, PENZES N, et al. Links among Obesity, Type 2 Diabetes Mellitus, and Osteoporosis: Bone as a Target. Int J Mol Sci. 2024;25(9):4827. [15] LU Y, LIU S, QIAO Y, et al. Waist-to-height ratio, waist circumference, body mass index, waist divided by height0.5 and the risk of cardiometabolic multimorbidity: A national longitudinal cohort study. Nutr Metab Cardiovasc Dis. 2021;31(9):2644-2651. [16] HE HM, XIE YY, CHEN Q, et al. The synergistic effect of the triglyceride-glucose index and a body shape index on cardiovascular mortality: the construction of a novel cardiovascular risk marker. Cardiovasc Diabetol. 2025;24(1):69. [17] ZHANG A, LI Y, MA S, et al. Conicity-index predicts all-cause mortality in Chinese older people: a 10-year community follow-up. BMC Geriatr. 2022;22(1):971. [18] DEMIRBAS N, KUTLU R. Importance of Measured Body Fat, Visceral Adiposity Index, and Lipid Accumulation Product Index in Predicting Cardiometabolic Risk Factors. Metab Syndr Relat Disord. 2021;19(3):174-179. [19] WHO. Obesity: preventing and managing the global epidemic. Report of a WHO consultation. World Health Organ Tech Rep Ser. 2000;894:i-xii, 1-253. [20] TURCOTTE AF, O’CONNOR S, MORIN SN, et al. Association between obesity and risk of fracture, bone mineral density and bone quality in adults: A systematic review and meta-analysis. PLoS One. 2021; 16(6):e0252487. [21] SALAMAT MR, SALAMAT AH, JANGHORBANI M. Association between Obesity and Bone Mineral Density by Gender and Menopausal Status. Endocrinol Metab (Seoul). 2016;31(4):547-558. [22] MA M, FENG Z, LIU X, et al. The Saturation Effect of Body Mass Index on Bone Mineral Density for People Over 50 Years Old: A Cross-Sectional Study of the US Population. Front Nutr. 2021;8:763677. [23] GRECO EA, FORNARI R, ROSSI F, et al. Is obesity protective for osteoporosis? Evaluation of bone mineral density in individuals with high body mass index. Int J Clin Pract. 2010;64(6):817-820. [24] JOSE A, CHERIAN KE, NANDYAL MB, et al. Trabecular Bone Score and Bone Mineral Density in Postmenopausal Women with Morbid Obesity-A Clinical Paradox. Med Sci (Basel). 2021;9(4):69. [25] LI Y. Association between obesity and bone mineral density in middle-aged adults. J Orthop Surg Res. 2022;17(1):268. [26] LESLIE WD, ORWOLL ES, NIELSON CM, et al. Estimated lean mass and fat mass differentially affect femoral bone density and strength index but are not FRAX independent risk factors for fracture. J Bone Miner Res. 2014;29(11):2511-2519. [27] ODE J, KNOUS J, SCHLAFF R, et al. Accuracy of body mass index in volunteer firefighters. Occup Med (Lond). 2014;64(3):193-197. [28] ZHAO Z, JI H, LIU W, et al. The saturation effect of a body shape index on lumbar bone mineral density in US adults: Findings from a nationwide survey. PLoS One. 2025;20(6):e0324160. [29] KIM B, KIM GM, KIM E, et al. The Anthropometric Measure ‘A Body Shape Index’ May Predict the Risk of Osteoporosis in Middle-Aged and Older Korean People. Int J Environ Res Public Health. 2022;19(8):4926. [30] DENG G, YIN L, LI K, et al. Relationships between anthropometric adiposity indexes and bone mineral density in a cross-sectional Chinese study. Spine J. 2021;21(2):332-342. [31] 邓桂娟,程晓光,尹潞,等.中老年高血压人群肥胖与骨质疏松相关性研究[J].中国循环杂志,2019,34(11):1091-1097. [32] CIOVACCO WA, GOLDBERG CG, TAYLOR AF, et al. The role of gap junctions in megakaryocyte-mediated osteoblast proliferation and differentiation. Bone. 2009;44(1):80-86. [33] KIM HL, CHO HY, PARK IY, et al. The positive association between peripheral blood cell counts and bone mineral density in postmenopausal women. Yonsei Med J. 2011;52(5):739-745. [34] 张金鹏,陈畅,潘秋予,等.中老年人群血小板计数与腰椎骨密度的相关性[J].中国组织工程研究,2023,27(31):5046-5051. [35] KRISTJANSDOTTIR HL, MELLSTROM D, JOHANSSON P, et al. High platelet count is associated with low bone mineral density: The MrOS Sweden cohort. Osteoporos Int. 2021;32(5):865-871. [36] ZHANG Y, ZHAO B, HUANG Z, et al. Sex-specific association between platelet content and bone mineral density in adults: a cross-sectional study. BMC Musculoskelet Disord. 2024;25(1):875. [37] 朱玲,李倩,翟建,等.中老年体检女性血常规指标与定量CT腰椎骨密度的相关性研究[J].中国骨质疏松杂志,2022,28(12): 1787-1790. [38] KHAN FA, PARAYARUTHOTTAM P, ROSHAN G, et al. Platelets and Their Pathways in Dentistry: Systematic Review. J Int Soc Prev Community Dent. 2017;7(Suppl 2):S55-S60. [39] HUANG Y, YE J. Association between hypertension and osteoporosis: a population-based cross-sectional study. BMC Musculoskelet Disord. 2024;25(1):434. [40] YE Z, LU H, LIU P. Association between essential hypertension and bone mineral density: a systematic review and meta-analysis. Oncotarget. 2017;8(40):68916-68927. [41] CHAI H, GE J, LI L, et al. Hypertension is associated with osteoporosis: a case-control study in Chinese postmenopausal women. BMC Musculoskelet Disord. 2021;22(1):253. [42] 张栋楠,马春芬,王国华,等.男性高血压患者QCT检测与腰椎骨密度的相关性[J].中国骨质疏松杂志,2022,28(10):1476-1479,1484. [43] 杜亚玮,戚昕,周阳,等.不同性别人群定量CT骨密度与血压和血脂的相关性分析[J].放射学实践,2025,40(2):248-253. [44] CHEN X, HE B, ZHOU Y, et al. Investigating the effect of history of fractures and hypertension on the risk of all-cause death from osteoporosis: A retrospective cohort study. Medicine (Baltimore). 2023; 102(13):e33342. [45] YANG S, NGUYEN ND, CENTER JR, et al. Association between hypertension and fragility fracture: a longitudinal study. Osteoporos Int. 2014;25(1):97-103. [46] VESTERGAARD P, PEJNMARK L, MOSEKILDE L. Hypertension is a risk factor for fractures. Calcif Tissue Int. 2009;84(2):103-111. [47] GHADIRI-ANARI A, MOETEZAII-SHOROKI Z, MODARRESI M, et al. Association of lipid profile with bone mineral density in postmenopausal women in Yazd province. Int J Reprod Biomed. 2016;14(9):597-602. [48] YANG P, LI D, LI X, et al. High-density lipoprotein cholesterol levels is negatively associated with intertrochanter bone mineral density in adults aged 50 years and older. Front Endocrinol (Lausanne). 2023; 14:1109427. [49] ZOLFAROLI I, ORTIZ E, GARCIA-PEREZ MÁ, et al. Positive association of high-density lipoprotein cholesterol with lumbar and femoral neck bone mineral density in postmenopausal women. Maturitas. 2021;147:41-46. [50] XIE R, HUANG X, LIU Q, et al. Positive association between high-density lipoprotein cholesterol and bone mineral density in U.S. adults: the NHANES 2011-2018. J Orthop Surg Res. 2022;17(1):92. |
| [1] | Yang Zhijie, Zhao Rui, Yang Haolin, Li Xiaoyun, Li Yangbo, Huang Jiachun, Lin Yanping, Wan Lei, HuangHongxing. Postmenopausal osteoporosis: predictive values of muscle mass, grip strength, and appendicular skeletal muscle index [J]. Chinese Journal of Tissue Engineering Research, 2026, 30(5): 1073-1080. |
| [2] | Jiang Yang, Peng Hao, Song Yanping, Yao Na, Song Yueyu, Yin Xingxiao, Li Yanqi, Chen Qigang. Isometric exercise reduces resting blood pressure: a meta-analysis of moderating factors and dose effects [J]. Chinese Journal of Tissue Engineering Research, 2026, 30(4): 975-986. |
| [3] | Zeng Hao, Sun Pengcheng, Chai Yuan, Huang Yourong, Zhang Chi, Zhang Xiaoyun. Association between thyroid function and osteoporosis: genome-wide data analysis of European populations [J]. Chinese Journal of Tissue Engineering Research, 2026, 30(4): 1019-1027. |
| [4] | Hou Xiaoli, Cao Fuyuan, Gao Jingyuan, Xing Lei, Liu Ning, Zhang Nan, Fan Xinhao, Cao Guolong, Tian Faming. Serum remnant cholesterol reduces bone quality in obese mice [J]. Chinese Journal of Tissue Engineering Research, 2026, 30(24): 6189-6195. |
| [5] | Du Xingbin, Jiang Fugao, Kong Jianda. Traditional Chinese sports in the treatment of osteoporosis: potential biological mechanisms and clinical application progress [J]. Chinese Journal of Tissue Engineering Research, 2026, 30(23): 5943-5953. |
| [6] | Yin Xingxiao, Jiang Yang, Song Yanping, Yao Na, Shen Zhen, Li Yanqi, Song Yueyu, Peng Hao, Chen Qigang. Association between sarcopenia and osteoporosis: a genome-wide data analysis in European populations [J]. Chinese Journal of Tissue Engineering Research, 2026, 30(23): 6030-6039. |
| [7] | Wang Peng, Lu Huan, Liu Haifeng, Li Feng. Mechanism by which andrographolide intervenes in insulin resistance in rats with gestational diabetes mellitus [J]. Chinese Journal of Tissue Engineering Research, 2026, 30(12): 3058-3065. |
| [8] | Zhou Jiajun, Ma Fei, Leng Yebo, Xu Shicai, He Baoqiang, Li Yang, Liao Yehui, Tang Qiang, Tang Chao, Wang Qing, Zhong Dejun. Assessing distribution characteristics and clinical significance of vertebral fractures in patients with osteoporosis based on whole spine MRI [J]. Chinese Journal of Tissue Engineering Research, 2025, 29(9): 1883-1889. |
| [9] | Chen Shuai, Jin Jie, Han Huawei, Tian Ningsheng, Li Zhiwei . Causal relationship between circulating inflammatory cytokines and bone mineral density based on two-sample Mendelian randomization [J]. Chinese Journal of Tissue Engineering Research, 2025, 29(8): 1556-1564. |
| [10] | Wang Runzheng, Fu Su, Dong Chao, Li Dongzhe, Wang Yongkui. Relationship between bone mineral density and lumbar disc degeneration in middle-aged and elderly men and postmenopausal women [J]. Chinese Journal of Tissue Engineering Research, 2025, 29(24): 5079-5085. |
| [11] | Qiao Zhengji, Chai Niubing, Zheng Luyao, Gao Yunna, Wang Yang. Effect of whole‑body vibration training on bone mineral density in postmenopausal women: a meta‑analysis [J]. Chinese Journal of Tissue Engineering Research, 2025, 29(24): 5195-5202. |
| [12] | Li Xiupeng, Su Yuying, Wang Yuetong, Peng Liang, Wang Yida, Jing Wen. Effect of low-volume high-intensity interval training on cardiovascular risk factor in obese or overweight populations: a Meta-analysis [J]. Chinese Journal of Tissue Engineering Research, 2025, 29(12): 2590-2604. |
| [13] | Liu Kedi, Chen Yongxi, Qin Haibiao, Guo Shenghui, Qin Zhongshe, Meng Juewei, Cui Shanlin, Fan Junhong. Causal relationship between peripheral blood cells and osteoporosis [J]. Chinese Journal of Tissue Engineering Research, 2025, 29(12): 2605-2613. |
| [14] | Zhang Yibo, Lu Jianqi, Mao Meiling, Chen Lidan, Lu Wei, Zhang Zheng, Zhang Yunli, Chen Jiayong . Relationship between hypertension and osteoporosis in different racial groups [J]. Chinese Journal of Tissue Engineering Research, 2025, 29(12): 2614-2622. |
| [15] | Jiang Nan, Fu Haonan, Hao Yuhan, Chen Zhilin, Zhu Zhiqing, Xu Feng, Yu Dong. Causal association between cathepsins and bone mineral density: two-way Mendelian randomization analyses [J]. Chinese Journal of Tissue Engineering Research, 2025, 29(12): 2623-2630. |
| Viewed | ||||||
|
Full text |
|
|||||
|
Abstract |
|
|||||