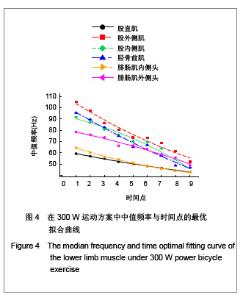
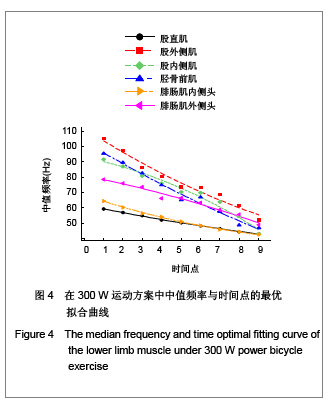
| [1] Wang GX. Tiyu Xuekan. 2004;11(1):45-48. 王国祥.不同负荷强度运动时表面肌电图中位频率与血乳酸浓度变化的关系[J].体育学刊, 2004,11(1):45-48.[2] Arendt-Nielsen L, Mills KR, Forster A. Changes in muscle fiber conduction velocity, mean power frequency, and mean EMG voltage during prolonged submaximal contractions. Muscle Nerve. 1989;12(6):493-497.[3] Krogh-Lund C, Jørgensen K. Modification of myo-electric power spectrum in fatigue from 15% maximal voluntary contraction of human elbow flexor muscles, to limit of endurance: reflection of conduction velocity variation and/or centrally mediated mechanisms. Eur J Appl Physiol Occup Physiol. 1992;64(4):359-370.[4] Wang GX,Li CH. Zhongguo Linchuang Kangfu. 2004;8(12): 28-31. 王国祥,李长宏.肘关节等速运动过程中表面肌电图的变化特征[J].中国临床康复,2004,8(12):28-31.[5] Cai LY,Wang ZZ,Zhang HH. Hangtian Yixue yu Yixue Gongcheng. 2000;13(2):124-127.蔡立羽,王志中,张海虹.表面肌电信号的复杂度特征研究[J].航天医学与医学工程,2000,13(2):124-127. [6] De Luca CJ. Physiology and mathematics of myoelectric signals. IEEE Trans Biomed Eng. 1979;26(6):313-325.[7] Meng YL, Liu BZ, Liu YP. A comprehensive nonlinear analysis of electromyogram. Engineering in Medicine and Biology Society, 2001. Proceedings of the 23rd Annual International Conference of the IEEE,2001: 1078-1081.[8] Webber CL Jr, Schmidt MA, Walsh JM. Influence of isometric loading on biceps EMG dynamics as assessed by linear and nonlinear tools. J Appl Physiol. 1995;78(3):814-822.[9] Bilodeau M, Schindler-Ivens S, Williams DM,et al. EMG frequency content changes with increasing force and during fatigue in the quadriceps femoris muscle of men and women. J Electromyogr Kinesiol. 2003;13(1):83-92.[10] Dimitrova NA, Dimitrov GV. Interpretation of EMG changes with fatigue: facts, pitfalls, and fallacies. J Electromyogr Kinesiol. 2003;13(1):13-36.[11] Wang J, Fang HG, Yang HC. Tiyu Kexue. 2005;25(5):39-43. 王健,方红光,杨红春.运动性肌肉疲劳的表面肌电非线性信号特征[J].体育科学, 2005,25(5):39-43.[12] Wang Y. Chongqing:Chongqing University,2011. 王燕.无氧功率自行车模式训练对田径运动员无氧能力及相关指标的影响[D]. 重庆:重庆大学, 2011.[13] Yang ZJ,Zhao GY. Shengwu Wuli Xuebao. 1998; 14(2): 257-261. 杨志家,赵光宇. 肌电信号的相空间分析[J]. 生物物理学报, 1998, 14(2): 257-261.[14] Mannion AF, Dolan P. The effects of muscle length and force output on the EMG power spectrum of the erector spinae. J Electromyogr Kinesiol. 1996;6(3):159-168. |
