Chinese Journal of Tissue Engineering Research ›› 2024, Vol. 28 ›› Issue (8): 1277-1282.doi: 10.12307/2024.214
Previous Articles Next Articles
Three-dimensional finite element analysis of the distribution pattern of stress in bone tissues with different characteristics
Xiaheida·Yilaerjiang, Nijiati·Tuerxun, Reyila·Kuerban, Baibujiafu·Yelisi, Chen Xin
- Department of Stomatology, Second Affiliated Hospital of Xinjiang Medical University, Urumqi 830063, Xinjiang Uygur Autonomous Region, China
-
Received:2022-12-05Accepted:2023-02-08Online:2024-03-18Published:2023-07-19 -
Contact:Nijiati·Tuerxun, Chief physician, Associate professor, Department of Stomatology, Second Affiliated Hospital of Xinjiang Medical University, Urumqi 830063, Xinjiang Uygur Autonomous Region, China -
About author:Xiaheida·Yilaerjiang, Master candidate, Department of Stomatology, Second Affiliated Hospital of Xinjiang Medical University, Urumqi 830063, Xinjiang Uygur Autonomous Region, China -
Supported by:Natural Science Foundation of Xinjiang Uygur Autonomous Region, No. 2016D01C192 (to NT)
CLC Number:
Cite this article
Xiaheida·Yilaerjiang, Nijiati·Tuerxun, Reyila·Kuerban, Baibujiafu·Yelisi, Chen Xin. Three-dimensional finite element analysis of the distribution pattern of stress in bone tissues with different characteristics[J]. Chinese Journal of Tissue Engineering Research, 2024, 28(8): 1277-1282.
share this article
Add to citation manager EndNote|Reference Manager|ProCite|BibTeX|RefWorks
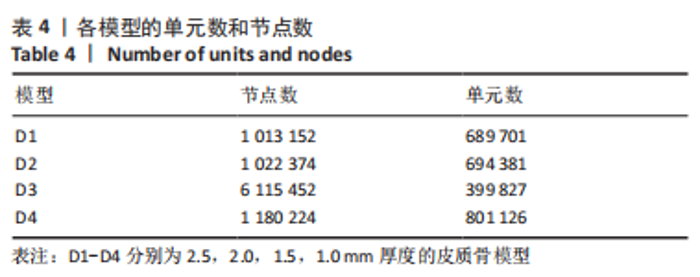
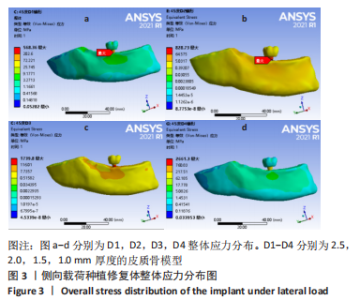
2.1 各组模型的具体单元数和节点数 见表4。"
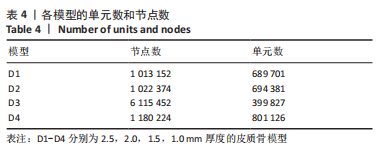

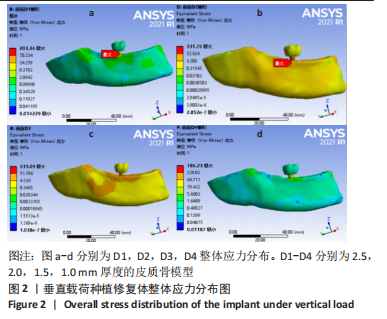
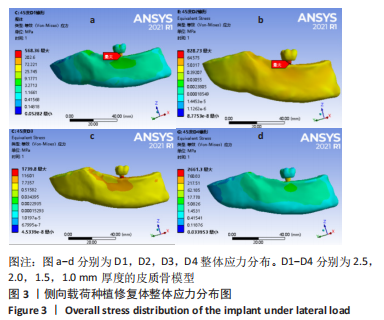
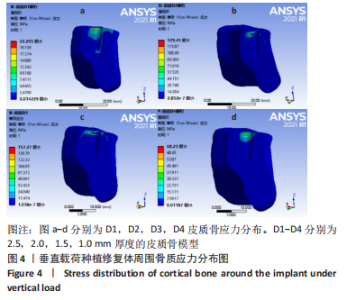
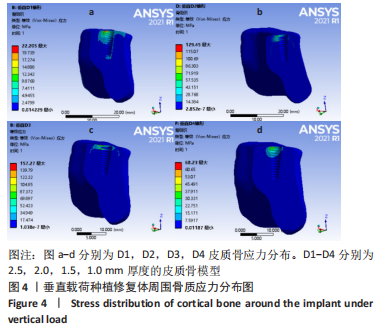
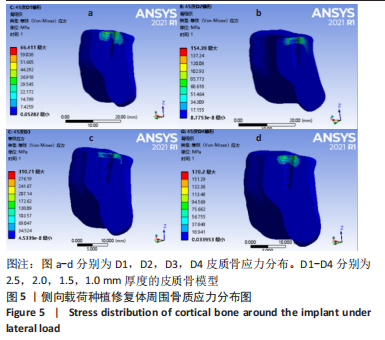
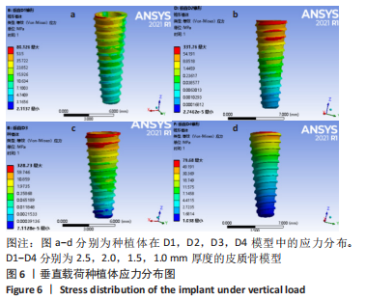
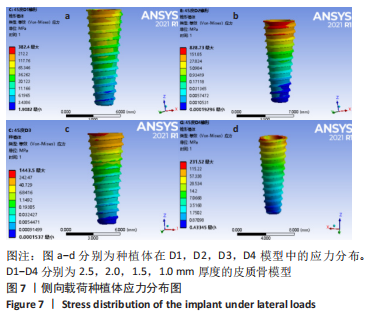
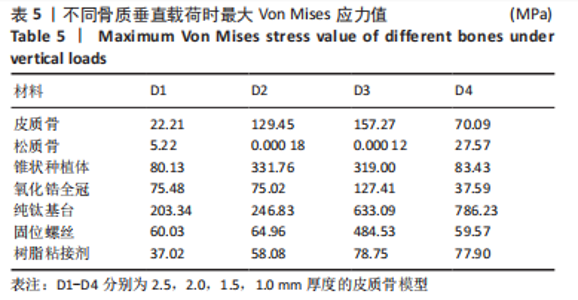
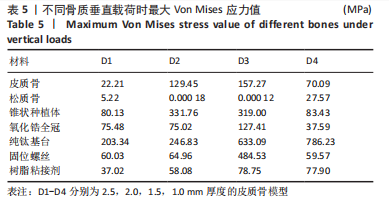
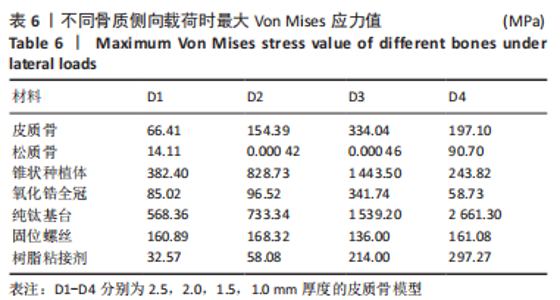
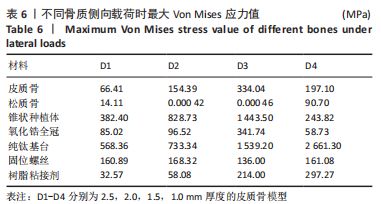
2.2 种植修复体整体应力分布情况 在此次实验中通过将皮质骨的厚度设置到0.5,1.0,1.5,2.0 mm并保持相同的种植体直径4.1 mm和恒定的皮质骨模量区模量,进行了皮质骨厚度对2种种植体-骨界面应力分布的影响。整体等效应力峰值随着皮质骨厚度减小而呈增高趋势(图2),且在D1-D4四种骨质模型整体应力峰值均为侧向载荷大于垂直载荷(图3)。图2,3显示了种植体-骨界面的轴向及侧向载荷时的应力分布,可以看出,在所有情况下,皮质骨处于高应力区,而松质骨处于低应力区,在D1-D4四种骨质模型中应力峰值集中在种植体-基台连接处。此外,种植体周围皮质骨可在种植体颈部周围观察到应力峰值且随着D1-D3应力峰值依次增大(图4,5),但在D4骨质模型中皮质骨应力峰值小且分布范围很居中。在D1-D3松质骨von Mises应力值随着皮质骨厚度的增加也呈降低趋势,在D4骨质模型中可见增大,且在D3、D4中松质骨应力集中在根尖部。垂直应力加载时,种植体位于皮质骨厚度为2.5 mm的D1模型中等效应力最大值集中于种植体与基台连接处,从种植体底部至基台上部1/3应力分布均匀。侧向加载应力在种植体中部1/3至基台上部分布;种植体在皮质骨厚度为2 mm的D2模型中及1 mm的D3模型中等效应力分布于种植体上部1/3至基台,侧向加载分布范围相同,但是应力值要大于垂直加载;但在皮质骨厚度为0.5 mm的D4模型中种植体周围皮质骨中的应力峰值降低,而且应力分布动图可见应力均集中在种植体-基台连接处,其余部分所受到的应力值很小,侧向载荷时应力集中点更为集中;在其余修复体上部修复体部件中可观察到,D1-D4骨质模型中纯钛基台应力峰值增大趋势明显,固位螺丝、树脂粘接剂、氧化锆全冠在D1-D3骨质模型中的应力峰值呈逐渐增高趋势,D4中却减小;锥状种植体未发现明显规律(图6,7)。见表5,6。"
"
"

"
"


"
"
"

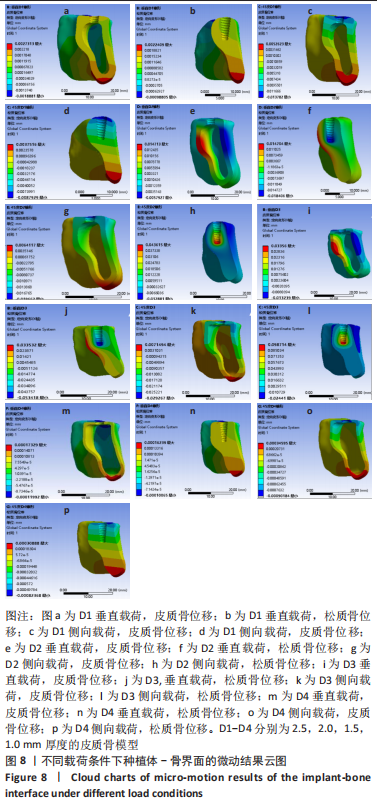
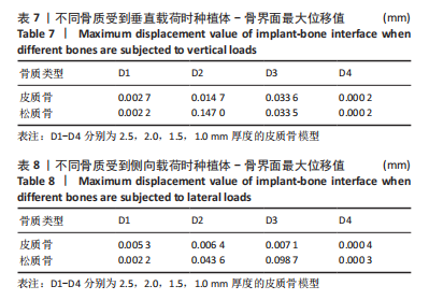
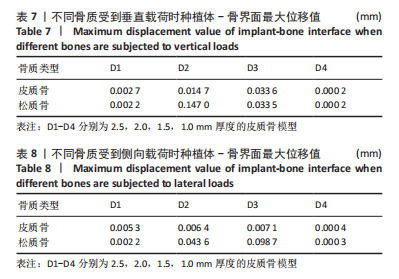
2.3 种植体-骨界面微动情况 在D1-D3骨质模型中种植体-皮质骨骨界面产生的微动峰值随着皮质骨厚度的减小而增加;垂直载荷下D1,D3种植体-骨界面的皮质骨微动峰值大于松质骨微动峰值;在D2,D4骨质模型中种植体-骨界面的松质骨微动峰值大于皮质骨微动峰值;侧向加载下D1,D4类骨质皮质骨微动峰值与松质骨模型,D2,D3类骨质模型中松质骨微动峰值大于皮质骨微动峰值;D1,D4骨质模型中皮质骨微动峰值侧向载荷大于垂直载荷,其余D2,D3骨质模型中均为垂直向载荷皮质骨微动峰值大于侧向载荷微动峰值;D1,D4骨质模型中松质骨微动峰值侧向载荷微动峰值与垂直加载微动峰值之间无明显差异;D2中松质骨微动峰值垂直载荷大于侧向载荷,D3相反。见图8及表7,8。"
"
| [1] FUGAZZOTTO PA. Success and failure rates of osseointegrated implants in function in regenerated bone for 72 to 133 months. Int J Oral Maxillofac Implants. 2005;20:77-83. [2] RABEL A, KÖHLER SG, SCHMIDT-WESTHAUSEN AM. Clinical study on the primary stability of two dental implant systems with resonance frequency analysis. Clin Oral Investig. 2007;11:257-265. [3] MERHEB J, VAN ASSCHE N, COUCKE W, et al. Relationship between cortical bone thickness or computerized tomography-derived bone density values and implant stability. Clin Oral Implants Res. 2010; 21(6):612-617. [4] SANTIAGO JUNIOR JF, VERRI FR, ALMEIDA DA, et al. Finite element analysis on influence of implant surface treatments, connection and bone types. Mater Sci Eng C Mater Biol Appl. 2016;63:292-300. [5] AYALI A, ALTAGAR M, OZAN O, et al. Biomechanical comparison of the All-on-4, M-4, and V-4 techniques in an atrophic maxilla: A 3D finite element analysis. Comput Biol Med. 2020;123:103880. [6] 康非吾,卢军,潘可风.种植区骨皮质厚度对种植体骨界面应力分布的影响[J].同济大学学报(医学版),2006(1):31-33. [7] 赵楚翘,徐一驰,刘定坤,等.髓腔固位冠及桩核冠修复下颌第一磨牙大面积缺损的生物力学分析[J].口腔医学研究,2018,34(5): 513-517. [8] KANG N, WU YY, GONG P, et al. A study of force distribution of loading stresses on implant-bone interface on short implant length using 3-dimensional finite element analysis. Oral Surg Oral Med Oral Pathol Oral Radiol. 2014;118(5):519-523. [9] KIM YK, LEE JH, LEE JY, et al. A randomized controlled clinical trial of two types of tapered implants on immediate loading in the posterior maxilla and mandible. Int J Oral Maxillofac Implants. 2013;28: 1602-1611. [10] 施梦汝,谢伟丽,施武阁,等.柱形锥形种植体在不同种植深度的三维有限元研究[J].口腔医学,2019,39(7):577-580. [11] 鲍中波.骨质条件和种植体外形对ISRPD种植体承载能力影响的有限元分析[D].大连:大连医科大学,2021. [12] 孙江伟,王俊祥,白布加甫·叶力思,等.不同光滑颈圈种植体修复时应力分布的三维有限元分析[J].中国组织工程研究,2023, 27(7):1004-1011. [13] GOIATO MC, DOS SANTOS DM, SANTIAGO JF JR, et al. Longevity of dental implants in type IV bone: a systematic review. Int J Oral Maxillofac Surg. 2014;43(9):1108-1116. [14] 王维丽,马洁,李鑫,等.颌骨骨质类型对种植体骨界面应力分布影响的三维有限元分析[J].河北医药,2017,39(12):1771-1775. [15] 李希光,郅克谦,高岭,等. 基于三维有限元评价种植体不同倾斜角度在上颌后牙区骨量不足的应力分析[J].口腔医学研究,2019, 35(7):671-675. [16] 王媛,张杨.不同下颌骨密度对4颗种植体支持Locator式覆盖义齿的有限元生物力学分析[J].中国组织工程研究,2022,26(22): 3492-3497. [17] 陈庆生,陈笑风,单晔杰,等.松质骨和皮质骨厚度对种植体周围应力分布的影响[J].吉林大学学报(医学版),2016,42(2):204-209. [18] SEVIMAY M, TURHAN F, KILIÇARSLAN MA, et al. Three-dimensional finite element analysis of the effect of different bone quality on stress distribution in an implant-supported crown. J Prosthet Dent. 2005;93(3):227-234. [19] BURSTEIN AH, REILLY DT, MARTENS M. Aging of bone tissue: mechanical properties. J Bone Joint Surg Am. 1976;58:82-86. [20] PREMNATH K, SRIDEVI J, KALAVATHY N, et al. Evaluation of stress distribution in bone of different densities using different implant designs: a three-dimensional finite element analysis. J Indian Prosthodont Soc. 2013;13:555-559. [21] TURKYILMAZ I, AKSOY U, MCGLUMPHY EA. Two alternative surgical techniques for enhancing primary implant stability in the posterior maxilla: a clinical study including bone density, insertion torque, and resonance frequency analysis data. Clin Implant Dent Relat Res. 2008; 10:231-237. [22] NIIMI A, OZEKI K, UEDA M, et al. A comparative study of removal torque of endosseous implants in the fibula, iliac crest and scapula of cadavers: preliminary report. Clin Oral Implants Res. 1997;8(4): 286-289. [23] SENNERBY L, THOMSEN P, ERICSON LE. A morphometric and biomechanic comparison of titanium implants inserted in rabbit cortical and cancellous bone. Int J Oral Maxillofac Implants. 1992;7: 62-71. [24] O’SULLIVAN D, SENNERBY L, JAGGER D, et al. A comparison of two methods of enhancing implant primary stability. Clin Implant Dent Relat Res. 2004;6:48-57. [25] 周宏志,张可,王学玲,等.不同形态种植体在两种骨质内以不同角度植入的应力分析[J].口腔医学研究,2022,38(2):138-143. [26] EL-ANWAR MI, EL-TAFTAZANY EA, HAMED HA, et al. Influence of Number of Implants and Attachment Type on Stress Distribution in Mandibular Implant-Retained Overdentures: Finite Element Analysis. Open Access Maced J Med Sci. 2017;22;5(2):244-249. [27] CHRCANOVIC BR, ALBREKTSSON T, WENNERBERG A. Bone Quality and Quantity and Dental Implant Failure: A Systematic Review and Meta-analysis. Int J Prosthodont. 2017;30(3):219-237. [28] OSTMAN PO, HELLMAN M, WENDELHAG I, et al. Resonance frequency analysis measurements of implants at placement surgery. Int J Prosthodont. 2006;19(1):77-83. [29] WINTER W, MÖHRLE S, HOLST S, et al. Parameters of implant stability measurements based on resonance frequency and damping capacity: a comparative finite element analysis. Int J Oral Maxillofac Implants. 2010;25(3):532-539 [30] BARIKANI H, RASHTAK S, AKBARI S, et al. The effect of implant length and diameter on the primary stability in different bone types. J Dent (Tehran). 2013;10(5):449-455. |
| [1] | Wang Qiang, Li Shiyun, Xiong Ying, Li Tiantian. Biomechanical changes of the cervical spine in internal fixation with different anterior cervical interbody fusion systems [J]. Chinese Journal of Tissue Engineering Research, 2024, 28(6): 821-826. |
| [2] | Wei Yuanbiao, Lin Zhan, Chen Yanmei, Yang Tenghui, Zhao Xiao, Chen Yangsheng, Zhou Yanhui, Yang Minchao, Huang Feiqi. Finite element analysis of effects of sagittal cervical manipulation on intervertebral disc and facet joints [J]. Chinese Journal of Tissue Engineering Research, 2024, 28(6): 827-832. |
| [3] | Zhang Rui, Wang Kun, Shen Zicong, Mao Lu, Wu Xiaotao. Effects of endoscopic foraminoplasty and laminoplasty on biomechanical properties of intervertebral disc and isthmus [J]. Chinese Journal of Tissue Engineering Research, 2024, 28(6): 833-839. |
| [4] | Kang Zhijie, Cao Zhenhua, Xu Yangyang, Zhang Yunfeng, Jin Feng, Su Baoke, Wang Lidong, Tong Ling, Liu Qinghua, Fang Yuan, Sha Lirong, Liang Liang, Li Mengmeng, Du Yifei, Lin Lin, Wang Haiyan, Li Xiaohe, Li Zhijun. Finite element model establishment and stress analysis of lumbar-sacral intervertebral disc in ankylosing spondylitis [J]. Chinese Journal of Tissue Engineering Research, 2024, 28(6): 840-846. |
| [5] | Zhang Min, Peng Jing, Zhang Qiang, Chen Dewang. Mechanical properties of L3/4 laminar decompression and intervertebral fusion in elderly osteoporosis patients analyzed by finite element method [J]. Chinese Journal of Tissue Engineering Research, 2024, 28(6): 847-851. |
| [6] | Huang Peizhen, Dong Hang, Cai Qunbin, Lin Ziling, Huang Feng. Finite element analysis of anterograde and retrograde intramedullary nail for different areas of femoral shaft fractures [J]. Chinese Journal of Tissue Engineering Research, 2024, 28(6): 868-872. |
| [7] | Wang Mingming, Zhang Zhong, Sun Jianhua, Zhao Gang, Song Hua, Yan Huadong, Lyu Bin. Finite element analysis of three different minimally invasive fixation methods for distal tibial fractures with soft tissue injury [J]. Chinese Journal of Tissue Engineering Research, 2024, 28(6): 879-885. |
| [8] | Ning Tianliang, Wang Kun, Wang Lingbiao, Han Pengfei. Finite element analysis on correction effect of varus foot orthosis based on the three-point force principle [J]. Chinese Journal of Tissue Engineering Research, 2024, 28(6): 891-899. |
| [9] | Kaiyisaier•Abudukelimu, Maimaitimin•Abulimiti, Li Lei, Yang Xiaokai, Zhang Yukun, Liu Shuai. Effect of lumbar CT values in the diagnosis of osteoporosis in women patients with lumbar degenerative diseases [J]. Chinese Journal of Tissue Engineering Research, 2024, 28(6): 945-949. |
| [10] | Wang Liping, Lian Tianxing, Hu Yongrong, Yang Hongsheng, Zeng Zhimou, Liu Hao, Qu Bo. HU value of chest CT vertebral body in the opportunistic screening of type 2 diabetes mellitus osteoporosis [J]. Chinese Journal of Tissue Engineering Research, 2024, 28(6): 950-954. |
| [11] | Abuduwupuer·Haibier, Alimujiang·Yusufu, Maihemuti·Yakufu, Maimaitimin·Abulimiti, Tuerhongjiang·Abudurexiti. Meta-analysis of efficacy and safety of terlipatide and bisphosphate in the treatment of postmenopausal osteoporosis fractures [J]. Chinese Journal of Tissue Engineering Research, 2024, 28(4): 639-645. |
| [12] | Zhang Qianlong, Maihemuti•Yakufu, Song Chenhui, Liu Xiuxin, Ren Zheng, Liu Yuzhe, Muyashaer•Abudushalamu, Sajidan•Aikebaier, Ran Jian. Finite element analysis of the effect of the distribution position and content of bone cement on the stress and displacement of reverse femoral intertrochanteric fracture [J]. Chinese Journal of Tissue Engineering Research, 2024, 28(3): 336-340. |
| [13] | Chen Yuanyuan, Wang Wei, Zhao Lu, Annikaer·Aniwaer, Nijati·Turson. Finite element analysis of the influence of scaffold materials on the fixed restoration of edentulous maxillary implants under two designs [J]. Chinese Journal of Tissue Engineering Research, 2024, 28(3): 411-418. |
| [14] | Peng Zhixin, Yan Wengang, Wang Kun, Zhang Zhenjiang. Finite element analysis and structural optimization design of 3D printed forearm braces [J]. Chinese Journal of Tissue Engineering Research, 2023, 27(9): 1340-1345. |
| [15] | Wu Tianliang, Tao Xiuxia, Xu Hongguang. Influence of different bone mineral densities on cage subsidence after stand-alone oblique lateral interbody fusion: three-dimensional finite element analysis [J]. Chinese Journal of Tissue Engineering Research, 2023, 27(9): 1352-1358. |
| Viewed | ||||||
|
Full text |
|
|||||
|
Abstract |
|
|||||