作者须知
-
实验方法是搜集科学事实,检验科学假说,形成科学理论的实践基础,因而简洁、清晰、准确地撰写研究原著类文章的“材料/对象和方法”部分方法对于此类文章来讲,是十分重要的。
对实验方法的描述应达到以下目的:(1) 允许读者重复实验,再现论文结果,做到所描述的实验方法在相同条件下可被他人复制;(2)使读者相信实验结果可靠,且令人信服;(3) 使读者受益于实验材料和方法的介绍,以从中得到启发,从而引发进一步的思考和研究。
那么,什么是撰写“材料/对象和方法”部分最需要注意的问题呢?那就是要在描述实验方法时,在不赘述的情况下,提供尽可能多的细节,也就是必须提供能让他人重复实验的基本步骤。
对“材料/对象和方法”部分进行可重复性描述还利于审稿专家评估稿件的质量高低。如果审稿人对于实验方法提出强烈质疑,那么不管实验结果多么激动人心,审稿专家也会建议编辑拒绝录用稿件。
下面简单介绍几种常见的实验方法所应具备的步骤描述:
常用检测技术:
∴Western blot蛋白印迹法(免疫印迹)
Western blot流程:

方法描述的基本要求:
从XX细胞/XX组织中提取蛋白质,用RIPA裂解和提取缓冲液(KeyGen Biotechnology,中国南京)处理。用BCA方法测定蛋白浓度。等量蛋白质通过SDS-PAGE分离后,转移到PVDF膜上(EMD Millipore公司,Burlington, MA),然后用牛血清白蛋白(BSA,5%,v/v)封闭膜 。用适当稀释度的一抗在4℃下过夜孵育膜,然后将膜与二抗在室温下孵育1小时。ECL化学发光试剂盒(Thermo Fisher Scientific)进行曝光显影。最后使用ImageJ(National Institutes of Health, Bethesda, MD, USA)对蛋白条带进行半定量分析,最终结果以目的蛋白与内参的吸光度比值表示(蛋白归一)。(注:一抗和二抗应说明抗体名称,动物种属,生产厂家(城市、国家),工作浓度,目录号及RRID号)
样例1:
Western blot assay
IL-6, IL-1β and TNF-α expression levels were measured to evaluate the inflammatory response in spinal cord tissue and cells. NLRP3, apoptosis-associated speck-like protein containing a CARD (ASC), pro-Caspase-1, Caspase-1, GSDMD, and IL-18 levels were measured to evaluate pyroptosis. Nrf2 and HO-1 levels were measured to assess the Nrf2/ HO-1 signaling axis. First, 100 mg of spinal cord tissue was washed with PBS, fully lysed with radioimmunoprecipitation assay buffer (Beyotime, Shanghai, China) containing phenylmethylsulfonyl fluoride for 30 minutes, incubated on ice, and immediately centrifuged at 4°C. The supernatants were then collected, and the protein concentrations was determined using the bicinchoninic acid method (Abdulrahman et al., 2018) with the PierceTM BCA Protein Assay Kit (Thermo Fisher Scientific). The samples were loaded onto a polyacrylamide gel and electrophoresed. Next, the proteins were transferred to polyvinylidene fluoride membranes and blocked in 5% non-fat milk for 2 hours. Subsequently, the membranes were incubated overnight at 4°C with rat monoclonal primary antibodies against IL-6 (1:1000, Acris Antibodies GmbH, Herford, Germany; Cat# SM1695PX, RRID:AB_1004115), IL-1β (1:100, Miltenyi Biotec, Bergisch Gladbach, Germany; Cat# 130-125-220, RRID:AB_2889697), T N F - α ( 1 : 1 0 0 , M i l te ny i B i o te c ; C at # 1 3 0 - 1 0 2 - 3 8 6 , RRID:AB_2661141), NLRP3 (1:1000, MyBioSource, San Diego, CA, USA; Cat# MBS604215, RRID:AB_10911109), ASC (1:2000, Gabriel Nú?ez, University of Michigan, Ann Arbor, MI, USA; Cat# GN-ASC, RRID:AB_2750645), pro-Caspase-1 (1:1000, ProSci, San Diego, CA, USA; Cat# 48-495, RRID:AB_1945485), C a s p a s e - 1 ( 1 : 1 0 0 0 , A c r i s A n t i b o d i e s G m b H ; C a t # AP06610PU-N, RRID:AB_1611115), GSDMD (1:100, Thermo Fisher Scientific; Cat# A305-736A-M, RRID:AB_2782894), and IL-18 (1:100, DSHB, Iowa City, IA, USA; Cat# CPTC-IL18-2, RRID:AB_1553716), followed by incubation with horseradish peroxidase–conjugated rabbit anti-rat IgG (1:1000, Biorbyt, Cat# orb21564, RRID:AB_10932535) at 20°C for 1 hour, and finally stained with a diaminobenzidine solution. A Bio-Image (Bio-Rad Laboratories, Hercules, CA, USA) gel imaging system was used to collect images. The optical density was measured using ImageJ software. Glyceraldehyde-3-phosphate dehydrogenase (1:1000, LSBio (LifeSpan), Seattle, WA, USA; Cat# LS-C94067-150, RRID:AB_1932766) and β-actin (1:1000, Santa Cruz Biotechnology, Santa Cruz, CA, USA; Cat# sc-47778 HRP, RRID:AB_2714189) were used as internal references.
例2:
Western blot assay
At 6, 12 and 24 hours after TBI, five rats from each group were decapitated f under anesthesia. Brains were carefully removed, and the prefrontal cortex was quickly dissected on ice. The tissue samples were homogenized using the Tissue Protein Extraction Kit (CW0891; Beijing Kangwei Biotechnology Co., Ltd., Beijing, China). Afterwards, the homogenates were centrifuged at 12,000 ×g for 10 minutes at 4 °C. The total amount of protein in each supernatant fraction was determined using the Bio-Rad DC protein assay, and an aliquot of each supernatant was removed and stored at ?80 °C. Equal amounts of total supernatant protein in loading buffer were boiled for 5 minutes, and then separated on a 10% sodium dodecyl sulfate/polyacrylamide gel. The separated proteins were electrophoretically transferred onto polyvinylidene difluoride membranes. The membranes were then blocked for 2 to 3 hours at room temperature with TBST buffer (150 mM NaCl, 20 mM Tris-HCl, pH 7.4, 0.1% Tween-20) containing 5% milk. The blots were then incubated overnight at 4 °C with rabbit anti-OX1R polyclonal antibody (1:200, ab68718; Abcam, Hong Kong, China) and rabbit anti-rat β-actin monoclonal antibody (1:400, CW0096; Beijing Kangwei). Following incubation, the membranes were washed extensively with TBST, and then incubated for 1 hour at room temperature with horseradish peroxidase-conjugated goat anti-rabbit IgG (H+L) (1:2,000; ZB-2301, Beijing Zhongshan Golden Bridge Biotechnology Co., Ltd., Beijing, China) diluted in TBST containing 5% milk. After washing, the blots were incubated with a chemiluminescence substrate (32109, ECL Plus; Amersham Biosciences, Piscataway, NJ, USA) and quantified using Image Lab software (Bio-Rad). The blots were then stripped by incubation for 30 minutes at 70 °C in a solution containing 2% sodium dodecyl sulfate and 100 mM β-mercaptoethanol in 62.5 mM Tris-HCl, pH 6.8. Subsequently, the blots were re-probed using rabbit anti-β-actin monoclonal antibody (CW0096, Beijing Kangwei) to monitor loading of the gel lanes. Western blot analyses of OX1R in prefrontal cortical tissue were performed at 6, 12 and 24 hours after TBI. The optical density measurements of individual bands were normalized to the optical density of β-actin.
样例3:
Western blot assay
Protein extraction and quantification procedures were conducted for PC12 cells after PIK3R4 silencing with siRNA as follows. Lysis buffer (100–150 μL) containing 1 mM phenylmethylsulfonyl fluoride was added to PC12 cells in each well of the six-well plates. The cell lysate solutions were centrifuged at 14,000 × g for 3–5 minutes at 4°C, and the supernatants were collected. Protein concentrations were quantified using a bicinchoninic acid kit (Solarbio). The operation steps for spinal protein extraction and quantification were as follows. Mice in each group were sacrificed after the animals were anesthetized with a solution of 10% chloral hydrate as a sedative combined with 20% urethane analgesia. The mice were quickly placed on ice, and the spinal cords were carefully separated. From each mouse, 30 mg of lumbar spinal cord was removed and transferred to a 1.5 mL Eppendorf tube, and 200 μL pre-cooled lysis buffer was added. An electronic tissue grinder was used to grind the lumbar cord until there were no obvious particles. After 2 hours of lysis, the tissue lysate was centrifuged at 12,000 × g for 10 minutes at 4 °C, and the supernatant was collected.
Western blots were used for the semi-quantitative analysis of spinal proteins in each mouse group. Proteins (20–40 μg) were separated by sodium dodecyl sulfate-polyacrylamide gel electrophoresis and transferred to the polyvinylidene fluoride membranes (Millipore; Bedford, MA, USA). Membranes were blocked with 5% skim milk in PBS for 1 hour at room temperature and incubated with primary antibodies. The concentrations of primary antibodies were as follows: anti- AB_2263076; rabbit; Cat# 10494-1-AP; Proteintech China); anti-PIK3R4 (1:2000; RRID: AB_11141464; rabbit; Cat# ab128903; Abcam), anti-SOD1 (1:2000; RRID: AB_2193750; rabbit; Cat# 10269-1-AP; Proteintech China), anti-sequestosome 1 (SQSTM1, p62; 1:1000; RRID: AB_2810880; rabbit; Cat# ab109012; Abcam) and anti-microtubule-associated proteins 1A/1B light chain 3 (LC3; 1:2000; RRID: AB_2137737; rabbit; Cat# 14600-1-AP; Proteintech China). Horseradish peroxidase-conjugated goat anti-rabbit IgG (1:1500–2500; RRID: AB_2722564; Cat# SA00001-2; Proteintech China) was selected as the secondary antibody. Chemiluminescence was evaluated using the BeyoECL Plus Kit (Beyotime; Shanghai, China), and the detailed procedures were previously described (Zhang et al., 2018b). Image J software (National Institute of Health; Bethesda, MD, USA) was used to analyze protein band densities. Relative protein expression was normalized to glyceraldehyde-3-phosphate dehydrogenase.
∴Quantitative real-time PCR 实时定量 PCR
1.Quantitative real-time PCR流程:

2.方法描述的要求:
*qPCR实验方法应当按照“qPCR实验操作和文章发表指南:MIQE清单”中的要求进行,其必备的描述包括:
2.1 样本采集、处理和制备:样本来源于哪个物种、器官、组织。并简要描述样本,例如:肿瘤样本描述肿瘤细胞组织比例。RNA提取于新鲜组织还是冰冻组织(如果是冰冻,如何冰冻,冻了多长时间)。
2.2 核酸的质量控制:RNA的提取(操作环境、试剂、耗材中有无RNAase)、RNA的定量(有何种方法定量,量是多少),去除基因组DNA(gDNA)(描述gDNA污染程度。RNA样本是否经过DNase处理(包括DNase类型和反应条件)),质量评估(质量评估方法和结果。推荐使用凝胶电泳或微流控芯片rRNA分析),杂质残留(通过稀释样本做反转录来检测PCR抑制剂的存在,或者用SPUD等抑制试验)。
2.3 反转录:描述反转录的方法和试剂,包括:RNA模板量、引物种类、酶的类型与数量,反应体系及反应的时间和温度。
2.4 qPCR:基因信息(靶基因和参考基因的数据库登陆号(如:NCBI Gene数据库:基因id和序列的Accession Number),目标核酸的结构,目的基因长度)。引物信息(序列和浓度,结合位点。染料或探针:染料种类、探针序列)。实验设计(内参基因的选择、复孔、阴性阳性对照 )。反应体系及反应条件(聚合酶的名称和浓度、模板量、缓冲液化学组成,反应体系总量,反应温度及循环数(initial denaturation预变性-denaturation变性- annealing退火- extension/ elongation延伸)。仪器耗材(塑料耗材的透明度如货品,反应容器为单一管,排管还是板,制造商;当使用板时,还要提供板的密封方法)。
2.5 数据分析:标准曲线(对第一对引物制作标准曲线来分析扩增效率)。实验组和对照组的Ct(Cq)值 。数据计算方法和归一化方法。数据重复性如何。统计方法和计算软件。
术语统一:
1.qPCR指的是实时荧光定量PCR,RT-qPCR指反转录qPCR。
2.用于归一化的基因叫做参考基因(reference gene),而不是管家基因(housekeeping gene)。
3.TAQMAN探针应称为水解探针。
4.FRET是荧光共振能量转移探针(fluorescence resonance energy transfer probe)的总称 ,5.LightCycler-type探针应称为双杂交探针。
6.定量单词不用“quantitation”,而用“quantification” 。
方法描述的要求主要来源:http://www.360doc.com/content/19/0322/18/52645714_823433224.shtml
范例:
例1:
Quantitative real-time polymerase chain reaction
Total RNA of each brain sample was extracted using the TRIzol reagent (Invitrogen) according to the manufacturer’s protocol. The concentration of each RNA sample was quantified using ultraviolet spectrophotometry at 260/280 nm, only samples with an A260/280 > 1.8 were used for further analysis to ensure RNA quality. cDNA was transcribed using a SuperScript? III CellsDirect? cDNA Synthesis Kit (Invitrogen) from 1.5 μg of RNA. qRT-PCR analysis was performed using an Opticon 2 Real-Time PCR Detection System (Bio-Rad, Hercules, CA, USA) with the SYBR? Green PCR Master Mix (Applied Biosystems, USA). The primers were subjected to 40 cycles of amplification at 95 °C for 10 s and 60 °C for 1 min. GAPDH was used as an internal control and the expression level of each target gene was normalized to that of GAPDH using the 2?ΔΔCt method (Ct = threshold cycle).
The primer sequences were as follows:
MCP-1: forward 5′-GTGCTGACCCCAAGAGGAA-3′,
reverse 5′-TTGTGGAAAAGGTAGTGGATG C-3′
iNOS: forward 5′-TTGGAGCGAGTTGTGGATTG-3′,
reverse 5′-GTGAGGGCTTGGCTGAGTGA-3′
CD11b: forward 5′-CAGGGCAGGAGTCGTATTG-3′,
reverse 5′-GTCCATCAGCTTCGGTGTTG-3′
Arg-1: forward 5′-TGAACACGGCAGTGGCTTTA-3′,
reverse 5′-GTAGTCAGTCCCTGGCTTATGG-3′
YM1: forward 5′-GCAGAATAATGAGATCACTTACACAC-3′,
reverse 5′-ACGAAGGAATCTGATAACTGACTG-3′
CD206: forward 5′-AAACACAGACTGACCCTTCCC-3′,
reverse 5′- GTTAGTGTACCGCACCCTCC-3′
GAPDH: forward 5′- GGTGAAGGTCGGTGTGAACG-3′,
reverse 5′- CTCGCTCCTGGAAGATGGTG-3′
例2:
Real-time quantitative RT-PCR
Total mRNA from polarized microglia was extracted using the mRNA Capture Kit (Roche), and cDNA was synthesized using the Reverse Transcription System kit (Promega) following the manufacturer’s guidelines. Reactions were performed using the SYBR Green method in an ABI 7900HT sequence detection system (Applied Biosystems), with GAPDH as the endogenous reference gene (ERG). Samples were analyzed in duplicate and normalized to GAPDH. Oligonucleotides were designed by using the computer software Primer Express 2.0 (Applied Biosystems) and synthesized by Invitrogen. Primer specificity was computer tested by homology search with the human genome (BLAST, National Center for Biotechnology Information) and later confirmed by dissociation curve analysis. The difference between the Ct of the target gene and the Ct of the ERG ΔCt?=?CtTarget???CtERG is used to obtain the normalized amount of target (Nt), which corresponds to 2?ΔCt. The Nt reflects the relative amount of target transcripts with respect to the expression of the ERG. Primer sequences: CLEC10A, Fw, 5′-TACACCTGGATGGGCCTCAG-3′, Rev., 5′-TGTTCCATCCACCCACTTCC-3′; GAPDH, Fw 5′-CCTTCCGTGTCCCCACTG-3′, rev 5′-GACGCCTGCTTCACCACC-3′.
例3:
Quantitative real-time polymerase chain reaction
45?min after the last behavior test, mice were sacrificed under pentobarbital sodium. The spinal cord was quickly removed on ice, with the spinal cord at lower lumbar and upper sacral segment (L4-S4) dissected and total RNA extracted with Spin Column Animal Total RNA Purification Kit (Shenggong, China) as per standard protocols. RNA preparations were reverse transcribed to generate cDNA with FastKing RT Kit (TIANGEN, China). The cDNA products served as templates for real-time PCR analysis to observe the SK2 expression with the SK2-specific primers (Shenggong, China). The primers applied to amplify SK2 were 5′-CTGCTTGCTTACTGGAATCATG-3′ (forward) and 5′-CATCATGAAATTGTGCACATGC-3′ (reverse). Sense and antisense primers were located on different exons to avoid false-positive results due to genomic DNA contamination. PCRs were performed on LightCycler 480 System via fluorescent SYBR Green technology (Applied Biosystems, USA). Reaction protocols were in the following schema: 1?min at 95°C for enzyme activation followed by 40 cycles of 10?s at 95°C and 30?s at 60°C and 30?s at 72°C, followed by 95°C for 5?s and 60°C for 60?s. Melting curve analysis was performed to check the specificity of the amplification products. All reactions contained the same amount of cDNA. The relative expression ratio of SK2 mRNA was normalized to GAPDH gene expression using the ΔCt method (2-ΔΔCt).
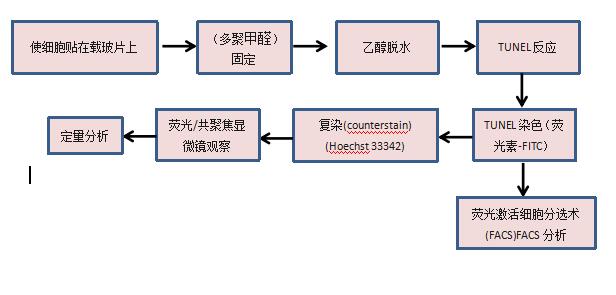
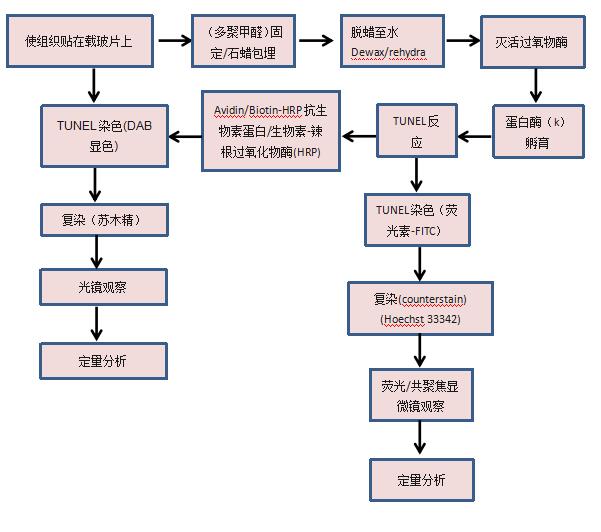
∴TUNEL染色
TUNEL染色流程:
(1)细胞:
(2)组织:
(编辑:李春会)