Design
The cytological experiment in vitro.
Time and setting
The experiment was performed from February to August in 2011 at the laboratory of Institute of Dental Medicine, Shandong University, China.
Materials
Animals
Eight male Sprague-Dawley rats were used for the experiment. They were from the Animal Experimental Center of Shandong University of Traditional Chinese Medicine, aged 14 days, weighing (56.5±6.2) g, License No. SCXK(Lu)20110003.
The rats were bred and maintained in a specific pathogen germ-free environment and the experiment was conducted according to the Guidance Suggestions for the Care and Use of Laboratory Animals, formulated by the Ministry of Science and Technology of China[20].
Reagent and instruments
.jpg)
Methods
Culture of bone marrow mesenchymal stem cells from rats
Bone marrow mesenchymal stem cells were isolated and harvested as previously described[10]. Eight male Sprague-Dawley rats 2-week-old were used as bone marrow donors. Bone marrow mesenchymal stem cells were cultured in vitro with the Sprague-Dawley rat mesenchymal stem cell growth medium by adherent culture. The medium contained low-glucose Dulbecco’s modified Eagle’s medium (DMEM) supplementing with 10% fetal bovine serum. Bone marrow mesenchymal stem cells were routinely cultured and expanded under normoxia (20% O2, 5% CO2).
Surface antigens of the third passage cells were examined by the flow cytometry. The cells were found to be positive for CD44 (99.98%) and CD29 (99.88%) and negative for CD34 (98.94%), and CD45 (98.23%). Osteogenic and adipogenic differentiation could be successfully induced.
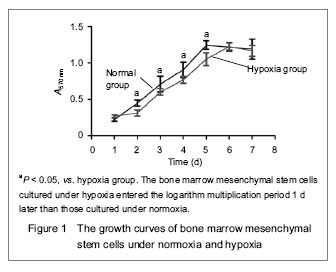
The growth curve of bone marrow mesenchymal stem cells under hypoxia (1% O2)
Bone marrow mesenchymal stem cells from the fourth passage were cultured in 96-hole culture plates at the density of 1×10⁷/L under hypoxia (1% O2, 5% CO2) and normoxia (20% O2, 5% CO2) in the incubators. The hypoxia was maintained at 1% O2, 5% CO2 by infusing a balanced nitrogen gas mixture. At each time point, three paralleled wells in each incubator were selected to be tested by 3-(4,5-Dimethylthiazol-2-yl)-2, 5-diphenyltetrazolium bromide assay.
Results were collected as the average. Cell growth curves under hypoxia (1% O2) and normoxia (20% O2) were generated to assess the influence of hypoxia (1% O2) on bone marrow mesenchymal stem cells proliferation.
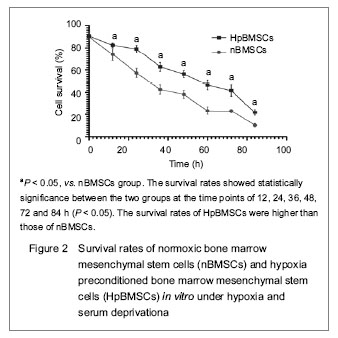
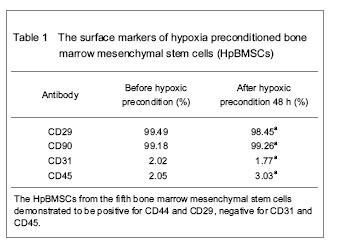
Hypoxic preconditioning of bone marrow mesenchymal stem cells
Bone marrow mesenchymal stem cells from the fifth passage were cultured under hypoxia (1% O2, 5% CO2) for 48 hours in the incubator. After this procedure, they were defined as hypoxia preconditioned bone marrow mesenchymal stem cells (HpBMSCs). The bone marrow mesenchymal stem cells from the fifth passage cultured under normoxia (20% O2, 5% CO2) were named normoxic bone marrow mesenchymal stem cells (nBMSCs), and they were collected as control samples. The cells and supernatant were collected for real time-PCR, western blot and enzyme linked immunosorbent assay (ELISA) tests.
HpBMSCs survival in vitro under hypoxia and serum-free condition
Part of the HpBMSCs were collected and resuspended by serum-free DMEM (low glucose) at the density of 1×10⁸/L. Then they were transported into the Eppendorf tubes. After being filled with the cellular suspension, 21 tubes of each group were sealed and placed into the incubator at 37 ℃. After 12, 24, 36, 48, 60, 72 and 84 hours respectively, every three tubes in each group were taken out for test randomly.
All the adherent and suspended cells in the three tubes of each group were collected and resuspended. Then the survival rates of the cells were calculated by the Automated Cell Counter with trypan blue exclusion test. nBMSCs were treated with the same method as controls.
Flow cytometry test
HpBMSCs were collected and made into single cell suspension (3×10⁹/L). Cell surface antigens (CD29, CD31, CD45, CD90) were examined by flow cytometry. nBMSCs at the same passage were collected and examined as controls.
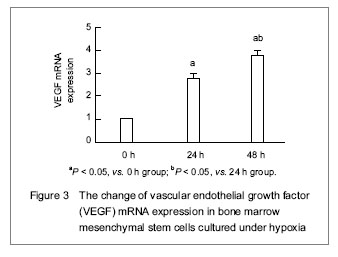
Real time PCR detection
The expression of vascular endothelial growth factor (VEGF) mRNA was examined by real time PCR. The total RNA was extracted with RNeasy Mini Kit. The primer sequences were adapted from previous work[21-22] and were produced by the Boshang Technology (Jinan, China).
The first primer sequence: 5’-GCT TTA CTG CTG TAC CTC CAC-3’; and the second primer sequence: 5’-AGA AGT TCG GCA GGA CAC-3’. After cDNA synthesis, each sample of 25 μL total volume was analyzed in duplicated by Mastercycler® ep realplex RT-PCR system. Product specificity was verified by melting curve analysis.
Glyceraldehyde-3-phosphate dehydrogenase (GAPDH) mRNA amplified from the same samples served as an internal control. The result of relative expression was analyzed by the method of 2-△△CT.
ELISA detection
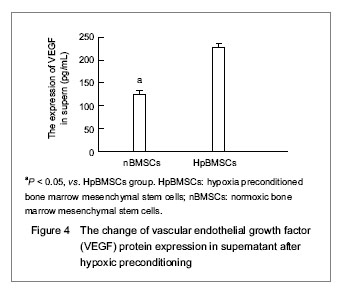
To observe the expression of VEGF protein after hypoxic preconditioning, the supernatant was collected at 48 hours. Three independent cultures were randomly selected for the test. The steps were done according to the instructions of the VEGF ELISA kit (R&D, USA). The average result after hypoxic preconditioning was compared with that under normoxia.
Western blot assay
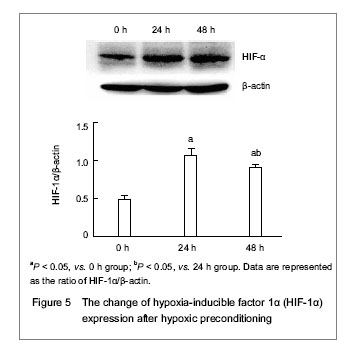
The expression of hypoxia-inducible factor 1α (HIF-1α) in HpBMSCs was determined by western blot assay. The protein lysate was separated by 10% sodium dodecyl sulfate polyacrylamide gel electrophoresis. Gels were then transferred to polyvinylidene fluoride membranes, blocked with Superbloch, and incubated with primary antibodies (Rabbit polyclonal antibody HIF-1α, Abcam) overnight at 4 ℃. Membranes were then washed in Tris-buffered saline, appropriate secondary antibodies (Goat anti-rabbit IgG, Beijing Zhongshan Golden Bridge) added for 2 hours. After washing with Tris-buffered saline S, the substrate and chemiluminescence were added and membranes developed using the digital imaging system (UVP). The grayscales were analyzed by using Image J 1.41 software.
Statistical Analysis
The results are expressed as mean±SD. All data were analyzed using SPSS 11.0 software (SPSS, Inc., USA). Comparisons between two means were performed by Unpaired Student’s t-tests. Multiple comparisons between three groups were performed by analysis of variance. P < 0.05 was considered statistically significant.