Chinese Journal of Tissue Engineering Research ›› 2019, Vol. 23 ›› Issue (24): 3840-3845.doi: 10.3969/j.issn.2095-4344.1294
Previous Articles Next Articles
Correlation between degenerative lumbar spondylolisthesis and spinal stenosis and muscle volume around the vertebral body: CT and MRI data analysis
- 1China-Japan Union Hospital of Jilin University, Changchun 130033, Jilin Province, China; 2General Hospital of Northern Theater Command Affiliated to Dalian Medical University, Shenyang 110000, Liaoning Province, China
-
Online:2019-08-28Published:2019-08-28 -
Contact:Zhao Baolin, Professor, China-Japan Union Hospital of Jilin University, Changchun 130033, Jilin Province, China -
About author:Rong Feilong, Master candidate, China-Japan Union Hospital of Jilin University, Changchun 130033, Jilin Province, China -
Supported by:the National Natural Science Foundation of China, No. 81701225 (to ZBY)
CLC Number:
Cite this article
Rong Feilong, Yin Ruofeng, Feng Mengmeng, Zhang Boyin, Liu Yi, Zhao Baolin.
share this article
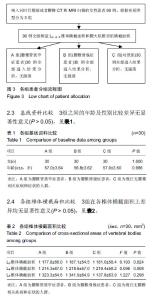
2.1 参与者数量分析 按意向性处理,纳入观察对象90例并分为3组,获取全部研究所需资料后,全部进入结果分析,无脱落。 2.2 试验流程图 见图3。"
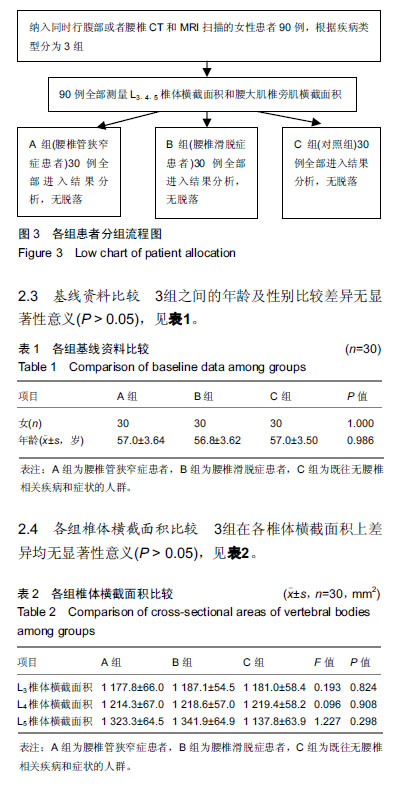
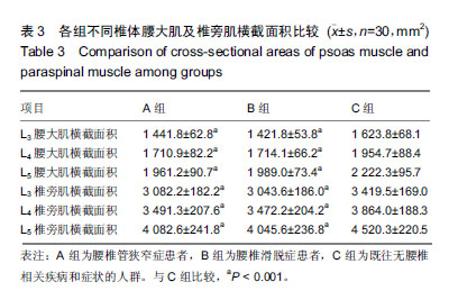
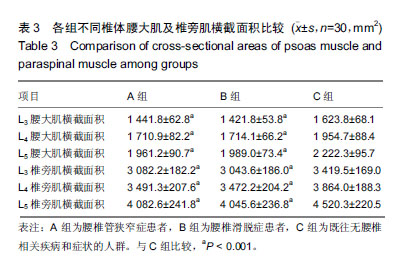
2.5 各组腰大肌及椎旁肌横截面积比较 腰大肌横截面积,A组与B组差异无显著性意义(P > 0.05),而A、B组均小于C组,差异有显著性意义(P < 0.001)。椎旁肌横截面积,A组与B组差异无显著性意义(P > 0.05),而A、B组均小于C组,差异有显著性意义(P < 0.001),见表3。"
| [1]Wagner H, Anders CH, Puta CH, et al. Musculoskeletal support of lumbar spine stability. Pathophysiology.2005;12(4):257-265.[2]Ward SR, Kim CW, Eng CM, et al. Architectural analysis and intraoperative measurements demonstrate the unique design of the multifidus muscle for lumbar spine stability. J Bone Joint Surg Am. 2009;91(1): 176-185.[3]Freeman MD, Woodham MA, Woodham AW. The role of the lumbar multifidus in chronic low back pain: a review. PM R. 2010;2(2):142-146.[4]Vives MJ. The paraspinal muscles and their role in the maintenance of global spinal alignment. Another wrinkle in an already complex problem. Spine J. 2016;16(4): 459-461.[5]Regev GJ, Kim CW, Tomiya A, et al. Psoas muscle architectural design, in vivo sarcomere length range, and passive tensile properties support its role as a lumbar spine stabilizer. Spine (Phila Pa 1976). 2011; 36(26): E1666-E1674.[6]Andersson EA, Grundström H, Thorstensson A. Diverging intramuscular activity patterns in back and abdominal muscles during trunk rotation. Spine (Phila Pa 1976). 2002;27(6): E152-160.[7]Ng JK, Richardson CA, Jull GA. Electromyographic amplitude and frequency changes in the iliocostalis lumborum and multifidus muscles during a trunk holding test. Phys Ther. 1997;77(9): 954-961.[8]Mannion AF, Käser L, Weber E, et al. Influence of age and duration of symptoms on fibre type distribution and size of the back muscles in chronic low back pain patients. Eur Spine J. 2000;9(4): 273-281.[9]韦以宗,田新宇,王慧敏,等. 腰大肌与腰椎运动力学关系动物实验研究[J]. 中国临床解剖学杂志, 2011, 29(1): 97-99.[10]Eguchi Y, Suzuki M, Yamanaka H, et al. Associations between sarcopenia and degenerative lumbar scoliosis in older women. Scoliosis Spinal Disord. 2017;12: 9.[11]Ranger TA, Cicuttini FM, Jensen TS, et al. Are the size and composition of the paraspinal muscles associated with low back pain? A systematic review. Spine J. 2017;17(11): 1729-1748.[12]朱康,孙根文,乔培柳,等. 椎旁肌横截面积变化可导致退行性腰椎滑脱[J]. 中国组织工程研究,2014,18(9):1392-1397.[13]Ravindra VM, Senglaub SS, Rattani A, et al. Degenerative lumbar spine disease: estimating global incidence and worldwide volume. Global Spine J. 2018;8(8): 784-794.[14]Hu ZJ, He J, Zhao FD, et al. An assessment of the intra- and inter-reliability of the lumbar paraspinal muscle parameters using CT scan and magnetic resonance imaging. Spine (Phila Pa 1976). 2011;36(13): E868-874.[15]Suh DW, Kim Y, Lee M, et al. Reliability of histographic analysis for paraspinal muscle degeneration in patients with unilateral back pain using magnetic resonance imaging. J Back Musculoskelet Rehabil. 2017; 30(3): 403-412.[16]Ranson CA, Burnett AF, Kerslake R, et al. An investigation into the use of MR imaging to determine the functional cross sectional area of lumbar paraspinal muscles. Eur Spine J. 2006;15(6): 764-773.[17]Society NAS. Diagnosis and Treatment of Degenerative Lumbar Spondylolisthesis 2nd Edition. North American Spine Society, 2014. 2nd Edition.[18]Society NAS. Diagnosis and Treatment of Degenerative Lumbar Spinal Stenosis. North American Spine Society, 2011.[19]Barker KL, Shamley DR, Jackson D. Changes in the cross-sectional area of multifidus and psoas in patients with unilateral back pain: the relationship to pain and disability. Spine (Phila Pa 1976). 2004;29(22): E515-519.[20]Landi A, Gregori F, Marotta N, et al. Hidden spondylolisthesis: unrecognized cause of low back pain? Prospective study about the use of dynamic projections in standing and recumbent position for the individuation of lumbar instability. Neuroradiology. 2015; 57(6): 583-588.[21]Arbanas J, Pavlovic I, Marijancic V, et al. MRI features of the psoas major muscle in patients with low back pain. Eur Spine J. 2013; 22(9): 1965-1971.[22]Modic MT, Ross JS. Lumbar degenerative disk disease. Radiology. 2007;245(1): 43-61.[23]Hides J, Gilmore C, Stanton W, et al. Multifidus size and symmetry among chronic LBP and healthy asymptomatic subjects. Man Ther. 2008;13(1): 43-49.[24]Dangaria TR, Naesh O. Changes in cross-sectional area of psoas major muscle in unilateral sciatica caused by disc herniation. Spine (Phila Pa 1976). 1998;23(8): 928-931.[25]Franke J, Hesse T, Tournier C, et al. Morphological changes of the multifidus muscle in patients with symptomatic lumbar disc herniation. J Neurosurg Spine. 2009;11(6): 710-714.[26]Wan Q, Lin C, Li X, et al. MRI assessment of paraspinal muscles in patients with acute and chronic unilateral low back pain. Br J Radiol. 2015;88(1053): 20140546.[27]Yalt?r?k K, Güdü BO, I??k Y, et al. Volumetric muscle measurements indicate significant muscle degeneration in single-level disc herniation patients. World Neurosurg. 2018; 116: e500-e504.[28]Matz PG, Meagher RJ, Lamer T, et al. Guideline summary review: An evidence-based clinical guideline for the diagnosis and treatment of degenerative lumbar spondylolisthesis. Spine J. 2016;16(3): 439-448.[29]闫广辉,李志赏,赵磊,等. 退行性腰椎滑脱症患者椎旁肌变化的影像学分析[J]. 中国临床研究, 2017, 30(4): 509-511.[30]Jayakumar P, Nnadi C, Saifuddin A, et al. Dynamic degenerative lumbar spondylolisthesis: diagnosis with axial loaded magnetic resonance imaging. Spine (Phila Pa 1976). 2006;31(10): E298-301.[31]Wang G, Karki SB, Xu S, et al. Quantitative MRI and X-ray analysis of disc degeneration and paraspinal muscle changes in degenerative spondylolisthesis. J Back Musculoskelet Rehabil. 2015;28(2): 277-285.[32]闫广辉,高春光,李华,等. 腰椎小关节三维角度与退行性腰椎滑脱症的相关性研究[J]. 实用放射学杂志, 2015,31(5): 810-812.[33]Morimoto M, Higashino K, Manabe H, et al. Age-related changes in axial and sagittal orientation of the facet joints: Comparison with changes in degenerative spondylolisthesis. J Orthop Sci. 2019;24(1):50-56.[34]Liu X, Zhao X, Long Y, et al. Facet sagittal orientation: possible role in the pathology of degenerative lumbar spinal stenosis. Spine (Phila Pa 1976). 2018;43(14): 955-958.[35]Ramhmdani S, Ishida W, Perdomo-Pantoja A, et al. Synovial cyst as a marker for lumbar instability: a systematic review and meta-analysis. World Neurosurg. 2019;122:e1059-e1068.[36]乔培柳,塔依尔•阿不都哈德尔. 腰椎退行性疾病椎旁肌的渐进变化[J]. 中国组织工程研究, 2014,18(44): 7205-7210.[37]Wagner SC, Sebastian AS, McKenzie JC, et al. Severe lumbar disability is associated with decreased psoas cross-sectional area in degenerative spondylolisthesis. Global Spine J. 2018; 8(7): 716-721.[38]Lescher S, Bender B, Eifler R, et al. Isometric non-machine-based prevention training program: effects on the cross-sectional area of the paravertebral muscles on magnetic resonance imaging. Clin Neuroradiol. 2011; 21(4): 217-222.[39]Sun D, Liu P, Cheng J, et al. Correlation between intervertebral disc degeneration, paraspinal muscle atrophy, and lumbar facet joints degeneration in patients with lumbar disc herniation. BMC Musculoskelet Disord. 2017;18(1): 167.[40]Crawford RJ, Elliott JM, Volken T. Change in fatty infiltration of lumbar multifidus, erector spinae, and psoas muscles in asymptomatic adults of Asian or Caucasian ethnicities. Eur Spine J. 2017;26(12): 3059-3067.[41]Crawford RJ, Volken T, Valentin S, et al. Rate of lumbar paravertebral muscle fat infiltration versus spinal degeneration in asymptomatic populations: an age-aggregated cross-sectional simulation study. Scoliosis Spinal Disord. 2016; 11: 21.[42]Kjaer P, Bendix T, Sorensen JS, et al. Are MRI-defined fat infiltrations in the multifidus muscles associated with low back pain? BMC Med. 2007; 5: 2.[43]Teichtahl AJ, Urquhart DM, Wang Y, et al. Fat infiltration of paraspinal muscles is associated with low back pain, disability, and structural abnormalities in community-based adults. Spine J. 2015; 15(7): 1593-1601. |
| [1] | Wang Haiying, Lü Bing, Li Hui, Wang Shunyi. Posterior lumbar interbody fusion for degenerative lumbar spondylolisthesis: prediction of functional prognosis of patients based on spinopelvic parameters [J]. Chinese Journal of Tissue Engineering Research, 2021, 25(9): 1393-1397. |
| [2] |
Zhang Cong, Zhao Yan, Du Xiaoyu, Du Xinrui, Pang Tingjuan, Fu Yining, Zhang Hao, Zhang Buzhou, Li Xiaohe, Wang Lidong.
Biomechanical analysis of the lumbar spine and pelvis in adolescent
idiopathic scoliosis with lumbar major curve |
| [3] | He Yujie, Wang Haiyan, Li Zhijun, Li Xiaohe, Cai Yongqiang, Dai Lina, Xu Yangyang, Wang Yidan, Xu Xuebin. Digital measurements of the anatomical parameters of pedicle-rib unit screw fixation in thoracic vertebrae of preschoolers [J]. Chinese Journal of Tissue Engineering Research, 2020, 24(6): 869-876. |
| [4] | Sun Jian, Fang Chao, Gao Fei, Wei Laifu, Qian Jun. Clinical efficacy and complications of short versus long segments of internal fixation for the treatment of degenerative scoliosis: a meta-analysis [J]. Chinese Journal of Tissue Engineering Research, 2020, 24(3): 438-445. |
| [5] | Liu Yang, Xu Baoshan, Xu Haiwei, Li Ning, Jiang Hongfeng, Wang Tao, Liu Yue. Imaging changes in spinal-pelvic sagittal alignment in sitting and standing positions in degenerative lumbar spondylolisthesis patients [J]. Chinese Journal of Tissue Engineering Research, 2020, 24(24): 3857-3861. |
| [6] | Xu Yangyang, Zhang Kai, Li Zhijun, Zhang Yunfeng, Su Baoke, Wang Xing, Wang Lidong, Wang Yidan, He Yujie, Li Kun, Wang Haiyan, Li Xiaohe. Morphological analysis of optimal selection of lumbar pedicle screws in adolescents aged 12-15 years [J]. Chinese Journal of Tissue Engineering Research, 2020, 24(21): 3321-3328. |
| [7] | Qin Haikuo, Luo Shixing. Correlation of cortical bone thickness and X-ray gray value in different planes of proximal femur with brittle fracture of female hip [J]. Chinese Journal of Tissue Engineering Research, 2020, 24(18): 2867-2872. |
| [8] | Huang Tianji, Yang Shengdong, Lin Hao, Zhang Chunyang, Deng Zhongqi, Zhong Weiyang, Luo Xiaoji. Mapping knowledge domains of bibliometrics regarding percutaneous vertebroplasty and percutaneous kyphoplasty based on VOSviewer [J]. Chinese Journal of Tissue Engineering Research, 2020, 24(15): 2410-2417. |
| [9] | Qu Renfei, Mai Yuying, Chen Xiaowei, Hu Huanying, Chen Guozhi, Li Dongdong, Liao Hongbing. Relationship between lactic acid concentration and osteoclast differentiation of mouse monocytes [J]. Chinese Journal of Tissue Engineering Research, 2020, 24(14): 2177-2183. |
| [10] | Liu Yapu, Lin Junyu, Yang Zhou, Wu Xiuhua, Wu Xiaoliang, Zhu Qing’an. Three-dimensional visualization and quantitative analysis of microvessels in rat cervical spinal cord using barium sulfate perfusion combined with micro-CT scanning [J]. Chinese Journal of Tissue Engineering Research, 2019, 23(36): 5836-5840. |
| [11] | Gao Yangyang, Che Xianda, Han Pengfei, Liang Bin, Li Pengcui. Clinical efficacy of unicompartmental knee arthroplasty between robotic-assisted and conventional manual methods: a meta-analysis [J]. Chinese Journal of Tissue Engineering Research, 2019, 23(36): 5889-5895. |
| [12] | Shao Yijie1, Jiang Huaye1, Gao Chao1, Luo Zongping2, Yang Huilin1. Effect of reduction of mechanical loading on subchondral bone and articular cartilage of early osteoarthritis in mice [J]. Chinese Journal of Tissue Engineering Research, 2019, 23(35): 5611-5618. |
| [13] | Lian Chao, Zhang Maorong, Wang Junyuan, Cheng Bo, Liu Feng. Relationship between femoral head diameter and edge load under dynamic micro-separation of ceramic hip joints [J]. Chinese Journal of Tissue Engineering Research, 2019, 23(32): 5085-5091. |
| [14] | Liu Hongwei, Jiang Junfeng, Zhang Yunkun, Xu Nanwei, Wang Caimei, Zhang Wen. Biomechanical comparison of personalized titanium femoral prosthesis fabricated by three-dimensional printing to four types of cementless prosthesis [J]. Chinese Journal of Tissue Engineering Research, 2019, 23(32): 5151-5157. |
| [15] | Shi Songyuan1, Peng Zhihui2. Current problems and potential treatment options for sports cartilage injury [J]. Chinese Journal of Tissue Engineering Research, 2019, 23(31): 5059-5064. |
| Viewed | ||||||
|
Full text |
|
|||||
|
Abstract |
|
|||||