Chinese Journal of Tissue Engineering Research ›› 2025, Vol. 29 ›› Issue (35): 7499-7510.doi: 10.12307/2025.947
Previous Articles Next Articles
Comparison of six machine learning models suitable for use in medicine: support for osteoporosis screening and initial diagnosis
Yang Lei1, Liu Sanmao2, 3, Sun Huanwei3, Che Chao1, Tang Lin1
- 1School of Software Engineering, Dalian University, Dalian 116622, Liaoning Province, China; 2The First Affiliated Hospital of Guangxi Medical University, Nanning 530021, Guangxi Zhuang Autonomous Region, China; 3The Affiliated Central Hospital of Dalian University of Technology, Dalian 116033, Liaoning Province, China
-
Received:2024-10-11Accepted:2024-12-10Online:2025-12-18Published:2025-04-30 -
Contact:Tang Lin, PhD, Associate professor, School of Software Engineering, Dalian University, Dalian 116622, Liaoning Province, China -
About author:Yang Lei, Master candidate, School of Software Engineering, Dalian University, Dalian 116622, Liaoning Province, China -
Supported by:National Natural Science Foundation of China, No. 62076045 (to CC); Dalian University Discipline Crossing Project, No. DLUXK-2023-YB-003 (to CC)
CLC Number:
Cite this article
Yang Lei, Liu Sanmao, Sun Huanwei, Che Chao, Tang Lin. Comparison of six machine learning models suitable for use in medicine: support for osteoporosis screening and initial diagnosis[J]. Chinese Journal of Tissue Engineering Research, 2025, 29(35): 7499-7510.
share this article
Add to citation manager EndNote|Reference Manager|ProCite|BibTeX|RefWorks

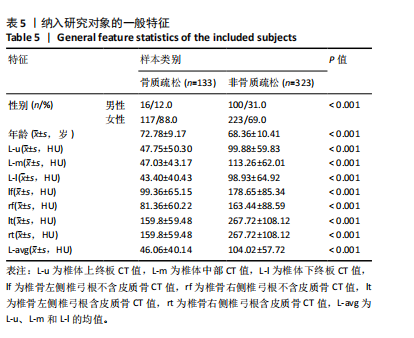
2.1 多种特征组合方案比较 对数据集纳入特征进行了均值、方差和显著性的统计,结果如表5所示。根据表中数据可知,实验数据集纳入特征的数据分布合理。各特征数据P值均 < 0.05,存在显著差异。"

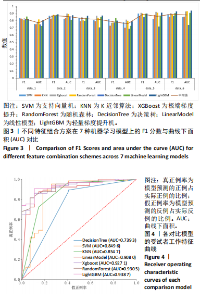
机器学习模型在医学预测问题中扮演着越来越重要的角色[27],尤其是在疾病的早期检测和诊断方面[28-30]。该研究选择对比了适用于医学预测问题的模型,包括支持向量机(SVM)[31-32]、K近邻算法(KNN)[33]、极端梯度提升(XGBoost)[34-35]、随机森林(RandomForest)[36]、决策树(DecisionTree)[37-38]、线性模型(LinearModel)[39]、轻量梯度提升机(LightGBM)这7种模型[40-41],目的是为了全面评估它们在骨质疏松症诊断中的表现。这些模型涵盖了从简单易解释的线性模型到复杂且性能优越的集成学习模型,考虑了模型的多样性和全面性。通过对比实验最终筛选出最适合骨质疏松预测的模型,为骨质疏松症的诊断提供可靠的模型支持。 由于测定数值范围存在差异,为消除不同量纲对机器学习算法和模型训练的影响,对数据进行归一化处理,将所有特征归一化,使得模型能够更准确地捕捉特征之间的关系,提高模型的性能和泛化能力。为了避免模型受到异常值的影响,选择Z-Score标准化来对数据处理,其转化公式为: x’=(x-μ)/δ (1) 其中,x为原始数据,x’为经过归一化处理后的数据,μ为原始数据集的均值,δ为原始数据集的标准差。 特征数据经过归一化处理后,采用随机抽样的方法按8∶2的比例将数据集划分为训练集和测试集。该研究对比了上述7个模型在6种不同特征选择方案下的最优表现,并通过F1分数和曲线下面积值评估不同特征组合在骨质疏松预测任务上的性能表现。 由图3可见,该研究提出的7点CT值测量方法,即特征组合方案data_6在不同模型的关键指标受试者工作特征曲线下面积和F1分数方面表现出了明显的性能提升。与data_1相比,平均曲线下面积提高了约10.89%,平均F1分数提高了约6.26%;相较于data_2,平均曲线下面积提高了约2.14%,平均F1分数提高了约2.01%;与data_3相比,平均曲线下面积提高了约5.92%,平均F1分数提高了约6.28%;与data_4相比,平均曲线下面积提高了约12.19%,平均F1分数提高了约10.44%。data_5和data_6在平均曲线下面积与平均F1分数上表现相当,data_6的最佳曲线下面积为0.878 3,高于data_5的0.860 5;data_6的最佳F1分数为0.889 6,也高于data_5的0.887 6。 综上所述,特征选择方案data_6展示了在骨质疏松症诊断中的适用性和有效性,印证了该研究提出的7点CT值测量方法的合理性和有效性。 2.2 多种机器学习模型预测结果比较 在最优特征组合方案data_6的基础上,实验采用随机抽样的方法按8∶2的比例将数据集划分为训练集和测试集。深入对比了7种机器学习算法在测试集上的多种指标,包括特异度、敏感度、精确率、召回率、F1分数、准确率和曲线下面积的表现,如表6所示,最终LightGBM表现最佳。 受试者工作特征曲线不仅能够展示模型在不同阈值下的表现,还能揭示模型在真实应用场景中的分类能力,更直观地评估模型在各种操作条件下的性能差异。图4可视化了上述7种机器学习模型在特征组合方案data_6上"
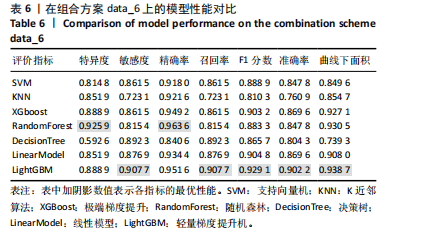
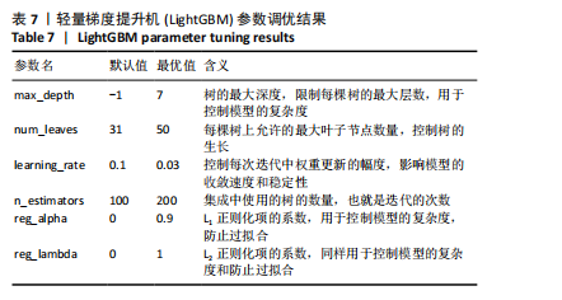
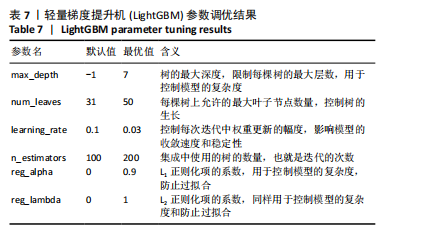
的受试者工作特征曲线,其中LightGBM曲线在大部分阈值范围内表现最优,进一步表明了LightGBM在骨质疏松症预测任务中具有显著的分类能力和较高的适用性。 除此之外,LightGBM还具有高效训练和较低计算成本的优势。它通过基于直方图的算法和优化的分裂策略,显著加快了模型的训练速度,同时减少了内存使用,这使得LightGBM不仅在大规模数据集上表现出色,还能够处理高维特征,从而提高了整体计算效率和模型的可扩展性。因此,LightGBM在骨质疏松症预测任务中,不仅提供了优异的预测性能,还具备了高效的训练优势。 该研究采用网格搜索方法优化模型超参数[42],以寻找模型的最佳表现,进而提升模型性能。网格搜索方法可以避免手动参数调整所带来的主观偏见、经验有限以及可能遗漏潜在优化点的影响。以LightGBM模型为例,实验中最终优化的超参数如表7所示。"

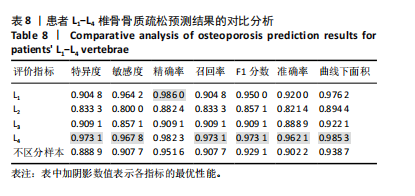
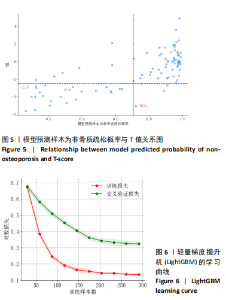
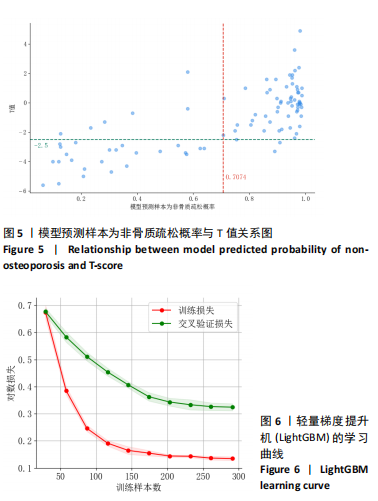
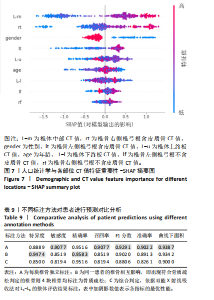
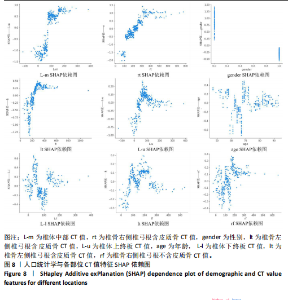
该研究采用约登指数计算分类的最佳阈值[43]。约登指数定义为真正例率与假正例率之间的差值。通过最大化约登指数,确定最优的分类阈值,以实现真正例率和假正例率的最佳平衡。实验计算得到的最优阈值为0.707 4。 换言之,当模型预测样本为非骨质疏松的概率值≥0.707 4时,该样本被分类为非骨质疏松;反之,则被分类为骨质疏松。图5使用散点图可视化了模型在测试集上的预测结果与金标准结果。 图6数据展示了LightGBM模型在不同训练样本数量下训练损失和交叉验证损失的变化趋势。横轴表示训练样本的数量,纵轴为对数损失值。分析结果显示,随着训练样本数量的增加,训练损失(红色曲线)和交叉验证损失(绿色曲线)均逐渐降低。这一趋势表明,模型在更大的数据集上训练后预测性能得到了增强。在样本数量较少时(例如少于100个样本),训练损失迅速下降;而当样本数量达到150个左右时,损失的下降速度开始减缓,并逐渐趋于稳定,这表明模型的性能得到了稳定,泛化能力得到了提升。随着样本量的增加,两条曲线趋于接近,显示了模型在处理新数据时的适应性和稳定性,同时避免了过拟合。这些结果证实了LightGBM在骨质疏松症预测任务中,即便在样本量有限的情况下,也能展现出较好的泛化能力和可靠性。 2.3 可解释性骨质疏松预测框架 尽管机器学习和人工智能在现代医学领域取得了显著进展,但难以深入解释内部运作过程,缺乏解释性会限制实际应用。在医学领域,需要明确的合理性和解释性,以确保临床医生和患者能够理解和信任模型的输出。为了解决这一问题,该研究引入了SHAP框架中的Tree SHAP,实现LightGBM模型进行可解释分析,生成的摘要图既可以呈现整体视角下骨质疏松相关特征重要性,又可以呈现每个特征对单个样本的影响。图7展示了整体视角下不同特征对预测骨质疏松症的影响程度,按重要程度由高到低排名依次是L-m,rt,gender,lt,L-u,age,L-l,lf,lr。L-m与骨质疏松症密切相关,符合临床观察结果。 图8进一步展示了模型预测过程中各特征的依赖关系,其中横轴表示特征值,纵轴代表该特征的SHAP值。SHAP值小于0意味着该特征在特定取值下对模型预测样本为骨质疏松有正向贡献,即该特征使得样本可能被预测为骨质疏松。反之亦然。此外,SHAP值的绝对值越大,表明该特征对模型预测结果的影响越大。 SHAP还能够集中可视化展示单个样本中各特征对预测结果的贡献,直观地呈现特征对模型预测的影响,如图9所示。其中,基准值(base value)表示预测结果正负概率相等。红色和蓝色特征的位置与基准值相比越向右偏移,表示预测为正例的概率越高,即被判断为非骨质疏松可能性越大。图9表示预测为非骨质疏松的概率高。红色特征表示对非骨质疏松预测的正向贡献,宽度反映了该特征贡献的强度,并按影响强度对特征进行了排序,L-m,rt,lt的CT值对结果影响较大。相反,蓝色特征表示对骨质疏松预测的负向贡献,影响强度的显示方式和排序与红色特征相同,属性gender=1表示性别为女性,该属性有负向影响。 2.4 基于可解释性骨质疏松预测框架的原型系统构建 基于该研究提出的可解释性骨质疏松预测框架,设计并开发了相应原型系统,旨在为临床医生、骨科专家、放射科医生等医疗专业人员及骨质疏松研究领域的科研人员提供落地实现原型,进一步展示该研究提出方法的实用性。所实现的原型系统采用B/S架构设计,基于Java的Spring Boot和VUE框架开发网站,基于Python训练并实现可解释性骨质疏松预测模型,同时基于Flask搭建了Python后端应用。使得用户无需安装客户端软件,只需通过Web浏览器即可访问系统。具体而言,首先用户通过页面输入患者相关信息后,单击预测按钮,网站会调用后端应用中的可解释性骨质疏松预测模型进行预测,并将预测结果返回至网站,通过前端页面展示预测类别、骨质疏松概率及SHAP分析的可视化结果。 2.5 患者L1-L4椎骨预测能力分析 针对不同的椎骨预测结果,进一步进行对比分析,包括患者分别使用L1、L2、L3、L4椎骨分别作为样本的预测结果,指标范围包括特异度、敏感度、准确率、召回率、F1分数、精确率、曲线下面积,如表8所示。"
2.6 不同标注方法对预测的影响分析 在实际患者诊断中,针对患者是否患有骨质疏松,是对某一个椎骨进行诊断且仅考虑有骨质疏松的椎骨,如果存在骨质疏松椎骨即判定患者所有椎骨为骨质疏松,还是综合衡量L1-L4椎骨,相关临床决策并没有明确的金标准。因此,该研究采用上述3种不同的方式分别标注样本,第1种标注方式(A)即前文中实验的标注方式,根据双能X射线吸收法测得的对应椎骨的T值进行细粒度标注;第2种标注方式(B)即患者如果L1-L4中包含任意一个可判定为骨质疏松的椎骨,则患者的L1-L4 4个样本均标注为骨质疏松;第3种标注方式(C)根据双能X射线吸收法针对L1-L4给出的综合判定结果,标注患者L1-L4 4个样本。比较了不同标注方式下的结果准确性,统计结果如表9所示。 2.7 基于外部数据集验证模型适用性 该研究从同一家医院收集了不同时间段的患者数据,构建了外部数据集,用于验证模型的适用性。通过使用时间上独立的数据集进行测试,评估模型对不同时间点不同患者群体具有稳定性与泛化能力,从而确保在实际临床应用中的可靠性。"

"
"

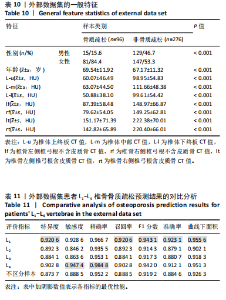
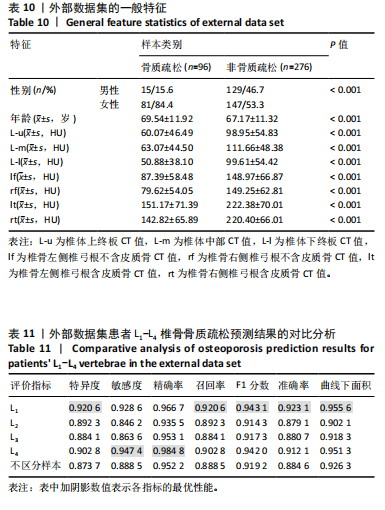
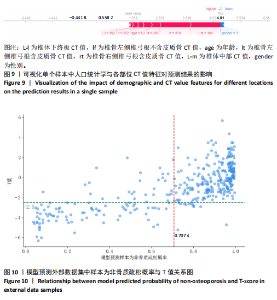
对外部数据集纳入特征进行了均值、方差和显著性统计和检验,如表10所示,外部数据集的数据分布合理,证实了外部数据集的代表性。 基于外部数据集进行模型适用性验证。表11中各椎骨和不区分样本的指标表现与前文原始数据测试集结果(表8)基本保持一致。其中,L1和L4椎骨的各项指标较L2和L3更高,与测试集结果一致。整体样本(不区分椎骨)的F1分数及曲线下面积分别达到0.919 2与0.926 3。模型预测的F1分数与曲线下面积均与原始数据测试集表现相当,这表明模型在外部数据集上对骨质疏松和非骨质疏松样本的分类能力保持稳定,进一步验证了良好的泛化能力和跨时间段数据的一致性,证实了模型的适用性。 图10展示了外部数据的模型预测结果与实际T值之间的关系。图中显示了预测概率与真实T值的正相关性,即T值越高(非骨质疏松倾向),模型预测的“非骨质疏松”概率越接近1。预测结果与临床金标准双能X射线吸收法测量的T值具有较高的一致性,而且与测试集(图5)的分布一致,进一步验证了模型在外部数据集上的可靠性和临床适用性。"
"

"

| [1] SONG S, GUO Y, YANG Y, et al. Advances in pathogenesis and therapeutic strategies for osteoporosis. Pharmacol Ther. 2022;237:108168. [2] RACHNER TD, KHOSLA S, HOFBAUER LC. Osteoporosis: now and the future. Lancet. 2011;377(9773):1276-1287. [3] LÖFFLER MT, JACOB A, SCHARR A, et al. Automatic opportunistic osteoporosis screening in routine CT: improved prediction of patients with prevalent vertebral fractures compared to DXA. Eur Radiol. 2021;31(8):6069-6077. [4] 孟凡,董敏洁,郭瑾,等.区老年人骨质疏松患病情况及全科防控策略[J]. 中国全科医学,2023,26(22):2778-2784. [5] 朱洁云,高敏,宋秋韵,等.中国老年人骨质疏松症患病率的Meta分析[J].中国全科医学,2022,25(3):346-353. [6] 中华医学会骨质疏松和骨矿盐疾病分会,章振林.原发性骨质疏松症诊疗指南(2022)[J].中国全科医学,2023,26(14):1671-1691. [7] 国家统计局,国务院第七次全国人口普查领导小组办公室.第七次全国人口普查公报(第五号):人口年龄构成情况[J].中国统计,2021(5):10-11. [8] WANG L, YU W, YIN X, et al. Prevalence of Osteoporosis and Fracture in China: The China Osteoporosis Prevalence Study. JAMA Netw Open. 2021;4(8):e2121106. [9] SI L, WINZENBERG TM, JIANG Q, et al. Projection of osteoporosis-related fractures and costs in China: 2010-2050. Osteoporos Int. 2015;26(7):1929-1937. [10] ZENG Q, LI N, WANG Q, et al. The Prevalence of Osteoporosis in China, a Nationwide, Multicenter DXA Survey. J Bone Miner Res. 2019;34(10):1789-1797. [11] 中国健康促进基金会基层医疗机构骨质疏松症诊断与治疗专家共识委员会.基层医疗机构骨质疏松症诊断和治疗专家共识(2021)[J].中国骨质疏松杂志,2021,27(7):937-944. [12] PICKHARDT PJ, CORREALE L, HASSAN C. AI-based opportunistic CT screening of incidental cardiovascular disease, osteoporosis, and sarcopenia: cost-effectiveness analysis. Abdom Radiol (NY). 2023;48(3):1181-1198. [13] GAO L, MOODIE M, WATTS JJ, et al. Cost-Effectiveness of Osteoporosis Opportunistic Screening Using Computed Tomography in China. Value Health Reg Issues. 2023;38:38-44. [14] SHIM JG, KIM DW, RYU KH, et al. Application of machine learning approaches for osteoporosis risk prediction in postmenopausal women. Arch Osteoporos. 2020;15(1):169. [15] BUI HM, HA MH, PHAM HG, et al. Predicting the risk of osteoporosis in older Vietnamese women using machine learning approaches. Sci Rep. 2022;12(1): 20160. [16] OU YANG WY, LAI CC, TSOU MT, et al. Development of Machine Learning Models for Prediction of Osteoporosis from Clinical Health Examination Data. Int J Environ Res Public Health. 2021;18(14):7635. [17] PARK HW, JUNG H, BACK KY, et al. Application of Machine Learning to Identify Clinically Meaningful Risk Group for Osteoporosis in Individuals Under the Recommended Age for Dual-Energy X-Ray Absorptiometry. Calcif Tissue Int. 2021;109(6):645-655. [18] NAM KH, SEO I, KIM DH, et al. Machine Learning Model to Predict Osteoporotic Spine with Hounsfield Units on Lumbar Computed Tomography. J Korean Neurosurg Soc. 2019;62(4):442-449. [19] 凯依塞尔·阿布都克力木,麦麦提敏·阿卜力米提,李磊,等.女性腰椎退行性病变患者腰椎CT值对骨质疏松症的诊断作用[J].中国组织工程研究, 2024,28(6):945-949. [20] 王晓文,招文华,颜先伟,等.腰椎椎弓根对应横断面椎体松质骨CT值与BMD值、T值的相关性[J].中国骨质疏松杂志,2022,28(10):1465-1471. [21] HAN K, YOU ST, LEE HJ, et al. Hounsfield unit measurement method and related factors that most appropriately reflect bone mineral density on cervical spine computed tomography. Skeletal Radiol. 2022;51(10):1987-1993. [22] SCHREIBER JJ, ANDERSON PA, HSU WK. Use of computed tomography for assessing bone mineral density. Neurosurg Focus. 2014;37(1):E4. [23] 杨思德.椎体松质骨CT值与双能X线骨密度值的相关性研究[D].桂林:桂林医学院,2023. [24] XU F, ZOU D, LI W, et al. Hounsfield units of the vertebral body and pedicle as predictors of pedicle screw loosening after degenerative lumbar spine surgery. Neurosurg Focus. 2020;49(2):E10. [25] KE G, MENG Q, FINLEY T, et al. Lightgbm: A highly efficient gradient boosting decision tree. 31st Conference on Neural Information Processing Systems (NIPS 2017), Long Beach, CA, USA. 2017. [26] LUNDBERG S, LEE SI. A unified approach to interpreting model predictions. Adv Neural Inf Process Syst. 2017;30:4765-4774. [27] DEO RC. Machine Learning in Medicine. Circulation. 2015;132(20):1920-1930. [28] ALI MM, PAUL BK, AHMED K, et al. Heart disease prediction using supervised machine learning algorithms: Performance analysis and comparison. Comput Biol Med. 2021;136:104672. [29] MARCOS-ZAMBRANO LJ, KARADUZOVIC-HADZIABDIC K, LONCAR TURUKALO T, et al. Applications of Machine Learning in Human Microbiome Studies: A Review on Feature Selection, Biomarker Identification, Disease Prediction and Treatment. Front Microbiol. 2021;12:634511. [30] KAVITHA C, MANI V, SRIVIDHYA SR, et al. Early-Stage Alzheimer’s Disease Prediction Using Machine Learning Models. Front Public Health. 2022;10:853294. [31] AZMI J, ARIF M, NAFIS MT, et al. A systematic review on machine learning approaches for cardiovascular disease prediction using medical big data. Med Eng Phys. 2022;105:103825. [32] CHEN Y, MAO Q, WANG B, et al. Privacy-Preserving Multi-Class Support Vector Machine Model on Medical Diagnosis. IEEE J Biomed Health Inform. 2022;26(7): 3342-3353. [33] UDDIN S, HAQUE I, LU H, et al. Comparative performance analysis of K-nearest neighbour (KNN) algorithm and its different variants for disease prediction. Sci Rep. 2022;12(1):6256. [34] GUAN X, DU Y, MA R, et al. Construction of the XGBoost model for early lung cancer prediction based on metabolic indices. BMC Med Inform Decis Mak. 2023;23(1):107. [35] BUDHOLIYA K, SHRIVASTAVA SK, SHARMA V. An optimized XGBoost based diagnostic system for effective prediction of heart disease. J King Saud Univ Comput Inf Sci. 2022;34(7):4514-4523. [36] HU J, SZYMCZAK S. A review on longitudinal data analysis with random forest. Brief Bioinform. 2023;24(2):bbad002. [37] SINGH LK, KHANNA M, SINGH R. Artificial intelligence based medical decision support system for early and accurate breast cancer prediction. Adv Eng Softw. 2023;175:103338. [38] AZAD C, BHUSHAN B, SHARMA R, et al. Prediction model using SMOTE, genetic algorithm and decision tree (PMSGD) for classification of diabetes mellitus. Multimedia Syst. 2022;28(4):1289. [39] SHEHAB M, ABUALIGAH L, SHAMBOUR Q, et al. Machine learning in medical applications: A review of state-of-the-art methods. Comput Biol Med. 2022;145: 105458. [40] DONG Z, WANG Q, KE Y, et al. Prediction of 3-year risk of diabetic kidney disease using machine learning based on electronic medical records. J Transl Med. 2022;20(1):143. [41] PENG X, LI L, WANG X, et al. A Machine Learning-Based Prediction Model for Acute Kidney Injury in Patients With Congestive Heart Failure. Front Cardiovasc Med. 2022;9:842873. [42] SUN Y, DING S, ZHANG Z, et al. An improved grid search algorithm to optimize SVR for prediction. Soft Computing. 2021;25:5633-5644. [43] FLUSS R, FARAGGI D, REISER B. Estimation of the Youden Index and its associated cutoff point. Biom J. 2005;47(4):458-472. [44] GUGLIELMI G, LANG TF. Quantitative computed tomography. Semin Musculoskelet Radiol. 2002;6(3):219-227. [45] LEE SJ, BINKLEY N, LUBNER MG, et al. Opportunistic screening for osteoporosis using the sagittal reconstruction from routine abdominal CT for combined assessment of vertebral fractures and density. Osteoporos Int. 2016;27(3):1131-1136. [46] KARA K, SIVRIOGLU AK, ARIBAL S, et al. The diagnosis of osteoporosis by measuring lumbar vertebrae density with MDCT: a comparative study with quantitative computerized tomography (QCT). Acta Medica Mediterr. 2013;29:775-779. [47] PU X, WANG D, GU S. Advances in Hounsfield units value for predicting cage subsidence on spinal interbody fusion surgery. Eur Spine J. 2023;32(9):3149-3157. [48] ZOU D, MUHEREMU A, SUN Z, et al. Computed tomography Hounsfield unit-based prediction of pedicle screw loosening after surgery for degenerative lumbar spine disease. J Neurosurg Spine. 2020;32(5):716-721. [49] ZOU D, SUN Z, ZHOU S, et al. Hounsfield units value is a better predictor of pedicle screw loosening than the T-score of DXA in patients with lumbar degenerative diseases. Eur Spine J. 2020;29(5):1105-1111. |
| [1] | Li Zikai, Zhang Chengcheng, Xiong Jiaying, Yang Xirui, Yang Jing, Shi Haishan. Potential effects of ornidazole on intracanal vascularization in endodontic regeneration [J]. Chinese Journal of Tissue Engineering Research, 2025, 29(在线): 1-7. |
| [2] | Lai Pengyu, Liang Ran, Shen Shan. Tissue engineering technology for repairing temporomandibular joint: problems and challenges [J]. Chinese Journal of Tissue Engineering Research, 2025, 29(在线): 1-9. |
| [3] | Li Jiagen, Chen Yueping, Huang Keqi, Chen Shangtong, Huang Chuanhong. The construction and validation of a prediction model based on multiple machine learning algorithms and the immunomodulatory analysis of rheumatoid arthritis from the perspective of mitophagy [J]. Chinese Journal of Tissue Engineering Research, 2025, 29(在线): 1-15. |
| [4] | Zhang Yibo, Lu Jianqi, Mao Meiling, Pang Yan, Dong Li, Yang Shangbing, Xiao Xiang. Exploring the causal relationship between rheumatoid arthritis and coronary atherosclerosis: a Mendel randomized study involving serum metabolites and inflammatory factors [J]. Chinese Journal of Tissue Engineering Research, 2025, 29(在线): 1-9. |
| [5] | Zhou Jinhai, Li Jiangwei, Wang Xuquan, Zhuang Ying, Zhao Ying, Yang Yuyong, Wang Jiajia, Yang Yang, Zhou Shilian. Three-dimensional finite element analysis of anterior femoral notching during total knee arthroplasty at different bone strengths [J]. Chinese Journal of Tissue Engineering Research, 2025, 29(9): 1775-1782. |
| [6] | Chen Xi, Tang Tao, Chen Tongbing, Li Qing, Zhang Wen. Mechanical stability of intertrochanteric fracture of femur with different internal fixation systems [J]. Chinese Journal of Tissue Engineering Research, 2025, 29(9): 1783-1788. |
| [7] | Fu Enhong, Yang Hang, Liang Cheng, Zhang Xiaogang, Zhang Yali, Jin Zhongmin. OpenSim-based prediction of lower-limb biomechanical behavior in adolescents with plantarflexor weakness [J]. Chinese Journal of Tissue Engineering Research, 2025, 29(9): 1789-1795. |
| [8] | Miao Jiahang, Ma Sheng, Li Qupeng, Yu Huilin, Hu Tianyu, Gao Xiao, Feng Hu. Cervical lordosis ratio can be used as a decision-making indicator for selection of posterior surgical approach for multi-level cervical spondylotic myelopathy [J]. Chinese Journal of Tissue Engineering Research, 2025, 29(9): 1796-1802. |
| [9] | Huang Haobo, Liang Xinyuan, Ye Guozhong, Xie Qingxiang, Su Boyuan. Suture tape and headless compression screws in treatment of Lisfranc injury with comminuted fractures of the first and second proximal metatarsal bones [J]. Chinese Journal of Tissue Engineering Research, 2025, 29(9): 1803-1809. |
| [10] | Liu Yan, Wang Kai, Wu Min. Relationship between coronal angle fluctuation of ankle point and recovery of joint function after ankle fracture [J]. Chinese Journal of Tissue Engineering Research, 2025, 29(9): 1820-1826. |
| [11] | Ao Xiaojing, Li Kun, Liu Yuhang, Yang Xiaoxuan, Wang Xing, Li Zhijun, Ren Xiaoyan, Zhang Shaojie. Development and application of a three-dimensional digital visualization system for children’s neck acupoints [J]. Chinese Journal of Tissue Engineering Research, 2025, 29(9): 1834-1840. |
| [12] | Zhang Hao, Wang Qing, Zhang Jian, Li Guangzhou, Wang Gaoju. Comparison of posterior C2-3 fixation combined with bucking bar technique and posterior C2-3 fixation alone in treatment of unstable Hangman fractures [J]. Chinese Journal of Tissue Engineering Research, 2025, 29(9): 1848-1854. |
| [13] | Su Lintao, Jiang Jianfeng, Ma Jun, Huang Liangliang, Lei Changyu, Han Yaozheng, Kang Hui. Precise application of O-arm navigation system in thoracolumbar fractures with developmental pedicle stenosis [J]. Chinese Journal of Tissue Engineering Research, 2025, 29(9): 1855-1862. |
| [14] | Gao Zhenyang, Zeng Xiuan, Yang Qibing, Kou Xianshuai, Wang Kejing, Li Meng. Computer-simulated repositioning combined with pelvic reduction frame for treatment of anteroposterior compression-III pelvic fractures [J]. Chinese Journal of Tissue Engineering Research, 2025, 29(9): 1870-1875. |
| [15] | Feng Zhimeng, Sun Ning, Sun Zhaozhong, Li Yuefei, Liu Changzhen, Li Sa. Three-dimensional image reconstruction can safely assist one-hole split endoscope in treatment of #br# L5/S1 far lateral lumbar disc herniation [J]. Chinese Journal of Tissue Engineering Research, 2025, 29(9): 1876-1882. |
| Viewed | ||||||
|
Full text |
|
|||||
|
Abstract |
|
|||||