| [1] Chiro GD,Brooks RA,Kessler RM,et al. Tissue signatures with dual-energy computed tomography. Radiology. 1979;131(2):521-523.
[2] Johnson TR. Dual-energy CT: general principles. AJR Am J Roentgenol. 2012;199(5):3-8.
[3] De Cecco CN, Darnell A, Rengo M, et al. Dual-en¬ergy CT: oncologic applications. AJR Am J Roent¬genol. 2012;199(5 ):98-105.
[4] Kaza RK, Platt JF, Cohan RH, et al. Dual-energy CT with single-and dual-source scanners: current applications in evaluating the genitourinary tract. Radio Graphics. 2012;32(2):353-369.
[5] Holmes DR III, Fletcher JG,Apel A, et al. Evaluation of non linear blending in dual-energy computed tomography. Eur J Radiol. 2008;68(3):409-413.
[6] Ho IM,Yoshizumi TT,Hurwitz LM, et al. Dual energy versussingle energy MDCT: measurement of radiation dose using adult abdominal imaging protocols.Acad Radiol. 2009;16(11):1400-1407.
[7] Graser A,Johnson TR,Bader M,et al. Dual energy CT character-ization of urinary calculi:initial in vitro and clinical expefence.Invest Radiol. 2008;43(2):112-119.
[8] Matsumoto K, Jinzaki M, Tanami Y, et al. Virtual monochromatic spectral imaging with fast kilovoltage switching: improved image quality as compared with that ob¬tained with conventional 120-kVp CT. Radiology. 2011;259(1):257-262.
[9] Schindera ST, Nelson RC, Mukundan S Jr, et al. Hypervascular liver tumors: low tube voltage, high tube current multi-detector row CT for enhanced detection- phantom study. Radiology. 2008;246(1):125-132.
[10] Song I, Yi JG, Park JH, et al. Virtual Non-Contrast CT Using Dual-Energy Spectral CT: Feasibility of Coronary Artery Calcium Scoring. Korean J Radiol. 2016;17(3): 321-329.
[11] Schwarz F, Nance JW Jr, Ruzsics B, et al. Quantification of coronary artery calcium on the basis of dual-energy coronary CT angiography. Radiology. 2012;264(3):700-707.
[12] Yu L, Leng S, McCollough CH. Dual-energy CT-based monochromatic imaging. AJR. 2012;199:9-15.
[13] Matsumoto K, Jinzaki M, Tanami Y, et al. Virtual monochromatic spectral imaging with fast kilo voltages witching: Improved image quality as compared with that obtained with conventional 120-kVp CT. Radiology. 2011;259(1):257-262.
[14] Zou Y, Silver MD. Analysis of fast KV-switching in dual energy CT using a pre-reconstruction decomposition technique. Proc Spie. 2008;13:6913.
[15] Primak AN, Ramirez Giraldo JC, Liu X, et al. “Improved dual-energy material discrimination for dual-source CT by means of additional spectral filtration.” Med. Phys. 2009, 36: 1359-1369.
[16] Roessl E, Proksa R. K-edge imaging in x-ray computed tomography using multi-bin photon counting detectors. Phys Med Biol. 2007;52: 4679-4696.
[17] Sullivan C. Calculating a water poverty index. World Dev. 2012;30(7):1195-1210.
[18] 黄英,刘新有,史正涛,等. 复杂系统评价指标的评价方法研究-以诚实水安全为例[J]. 水文,2009,29(2):45-49.
[19] Banerjee M, Chakraborty R, Ofori E, et al. Nonlinear regression on Riemannian manifolds and its applications to Neuro-image analysis. Med Image Comput Comput Assist Interv. 2015;9349(10): 719-727.
[20] Fang X, Liang C, Li M, et al. Dose-response relationship between dietary magnesium intake and cardiovascular mortality: A systematic review and dose-based meta-regression analysis of prospective studies. J Trace Elem Med Biol. 2016;29(3):S0946- 672X.
[21] He Y, Wang Y, Wang J, et al. Frequency-domain nonlinear regression algorithm for spectral analysis of broadband SFG spectroscopy. Opt Lett. 2016;41(5): 874-877.
[22] 汪哲荪,金菊良,李如忠,等. 基于风险的区域水安全评价模糊数随机模拟模型[J]. 四川大学学报,2010,42(6):1-5.
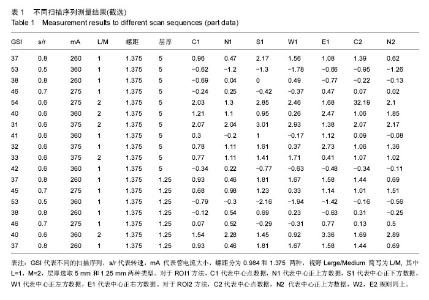
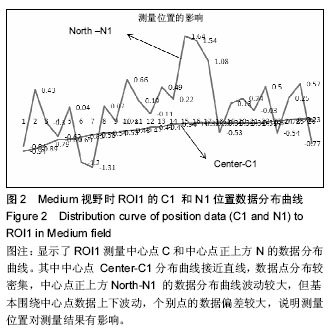
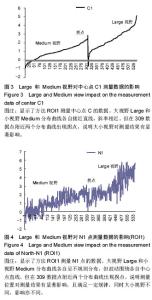
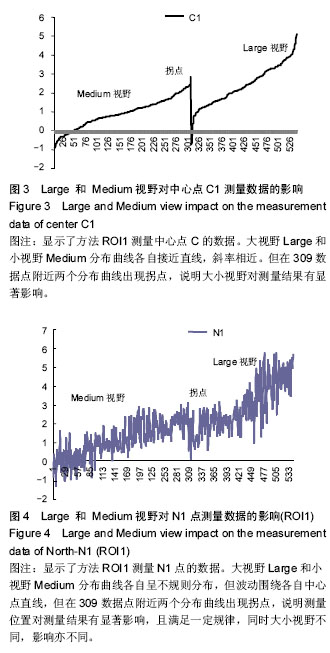
[23] 赵永为,郭小超,王霄英,等.扫描视野对双能CT成像CT值及物质分离的影响——模体研究[J]. 放射学实践, 2012, 27(3): 271-274.
[24] Evans JD, Whiting BR, O’Sullivan JA, et al. Prospects for in vivo estimation of photon linear attenuation coefficients using post processing dual-energy CT imaging on a commercial scanner: Comparison of analytic and poly energetic statistical reconstruction algorithms. Med Phys. 2013;40: 121914.
[25] He X, Feng X, Tong X, et al. Semiparametric partially linear varying coefficient models with panel count data. Lifetime Data Anal. 2016. [Epub ahead of print]
[26] Banerjee M, Chakraborty R, Ofori E, et al. Nonlinear regression on Riemannian manifolds and its applications to Neuro-image analysis. Med Image Comput Comput Assist Interv. 2015;9349(10):719-727.
[27] 汪嘉杨,王文圣,李祚泳,等.基于TS-SVM模型的水安全评价[J].水资源保护, 2010, 26(2): 1-9.
[28] 李祚泳,张正健,邹艳玲.蛙跳算法优化的地下水质评价的参数化组合算子模型[J].环境工程,2010,28(5):94-97.
[29] Zimmermann HJ, Zysco P. Latent connectives in human decision making. Fuzzy Sets Sys. 1980;(4): 37-51.
[30] Burden CJ, Qureshi SE, Wilson SR. Error estimates for the analysis of differential expression from RNA-seq count data. Peer J. 2014;23(9):e576. |